


PE supply remains high, facing challenges in destocking from March to May.
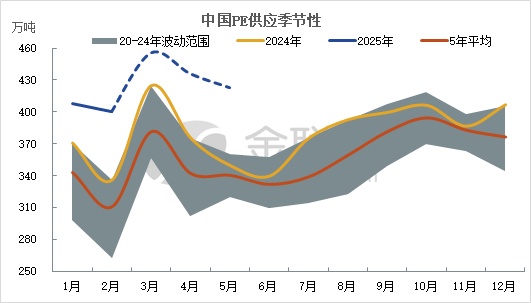
In March, the expected supply of PE in China (domestic + imported + recycled) is 4.55 million tons, a month-on-month increase of 13.72%. Domestically, several units including Pujie, Zhejiang Petrochemical, Yulong, and Wanhua are either shut down or in phased shutdowns. Meanwhile, the third line of Inner Mongolia Baofeng has been put into production, coupled with an increase in production days in March, resulting in a significant month-on-month increase in domestic production, estimated at 9.46%. In terms of varieties, the original EVA unit at Sinochem Quanzhou continues to produce LDPE, while other units are operating normally, with LDPE production proportion remaining stable compared to February. The price difference between HD injection molding and LLDPE has narrowed; in addition, considering the overall domestic maintenance and capacity expansion, the proportion of LLDPE production has decreased by 1 percentage point, while HDPE production has increased by 1 percentage point month-on-month.
In terms of imports, part of the overseas facilities underwent maintenance in the first quarter. Additionally, in mid-March, some plants in the Middle East and certain Southeast Asian countries reduced operations due to Ramadan. It is expected that PE imports in March would decrease by 13.97%.From April to May, China's PE supply remained at a high level, and the price expectation was low. It is expected that overseas PE resources will flow to regions with higher prices. China's import volume remained at a medium to low level.
In terms of recycled PE supply, the price difference between recycled PE and virgin material continues to narrow, but the gap remains around 1,500 yuan/ton. With increasing demand in March, the supply of recycled PE is expected to rebound rapidly. From April to May, there is a seasonal expectation of a decline in recycled PE supply. However, favorable policy support within the year suggests continued attention to the policy-driven boost in demand for recycled plastics.
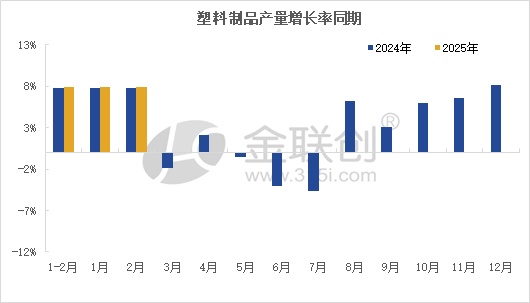
China's plastic products output reached 11.152 million tons in January-February 2025, increasing by 7.9% year-on-year.。Regarding exports,In February, China's plastic products exports totaled 1.6337 million tons, a year-on-year decrease of 7.33%. From January to February 2025, China's plastic products exports reached 4.8935 million tons, a year-on-year increase of 8.07%. Among them, China's PE shopping bag exports in February were 69,200 tons, down 7.07% year-on-year. From January to February 2025, China's cumulative exports of PE shopping bags were 201,500 tons, up 6.81% year-on-year.。
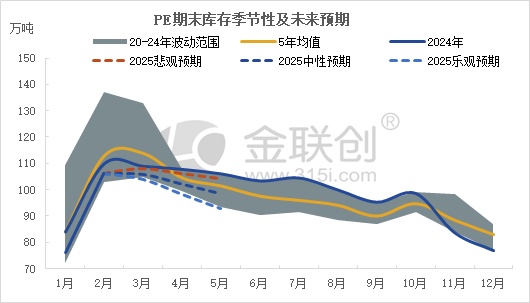
Downstream demand in March showed differentiation, with high overall domestic PE supply, and it is expected that the end-of-period inventory will lean towards a pessimistic outlook.From April to May, both maintenance and capacity expansion resources are released domestically, keeping the overall supply at a high level. It is expected that the PE end-of-period inventory will lean towards a pessimistic to neutral outlook.
【Copyright and Disclaimer】The above information is collected and organized by PlastMatch. The copyright belongs to the original author. This article is reprinted for the purpose of providing more information, and it does not imply that PlastMatch endorses the views expressed in the article or guarantees its accuracy. If there are any errors in the source attribution or if your legitimate rights have been infringed, please contact us, and we will promptly correct or remove the content. If other media, websites, or individuals use the aforementioned content, they must clearly indicate the original source and origin of the work and assume legal responsibility on their own.
Most Popular
-

AI Computing Power Demand Ignites Electronic Fabrics! China Jushi Hits Limit Up! Domestic Substitution Welcomes Golden Window
-

Focus on going global! kingfa sci. leads, huitong, preter, and kumho nire follow, china’s modified plastics frenziedly expanding worldwide
-

Back-to-back major joker moves! covestro’s 1.32 million ton mdi dual-line expansion and hdi acquisition reshape global polyurethane landscape
-

Evonik Parts Ways With The Polyester Business! A Strategic Retreat By A Germany Chemical Giant And The Global Industry Shift
-

PA66 Cost and Profit: Broad-Based Weakness in the Feedstock Market Continues to Erode Cost Support for PA66 (202606)


