


[pe daily review] market sentiment weakens, low-price transactions dominate
1. Today's Summary
①. U.S. commercial crude oil inventories have increased, and the market is concerned that OPEC+ may initiate a new production increase plan, leading to a decline in international oil prices. NYMEX crude oil futures for the October contract fell by $0.49 to $63.48 per barrel, a decrease of 0.77% compared to the previous period; ICE Brent crude futures for the November contract fell by $0.61 to $66.99 per barrel, a decrease of 0.90% compared to the previous period. China's INE crude oil futures for the 2510 contract fell by 8.2 to 483.6 yuan per barrel, and the night session fell by 0.3 to 483.3 yuan per barrel.
②、 The HDPE market price fluctuation range is -6 to 6 RMB/ton, the LDPE market price is -10 RMB/ton, and the LLDPE market price is -2 RMB/ton.
2. Spot Overview
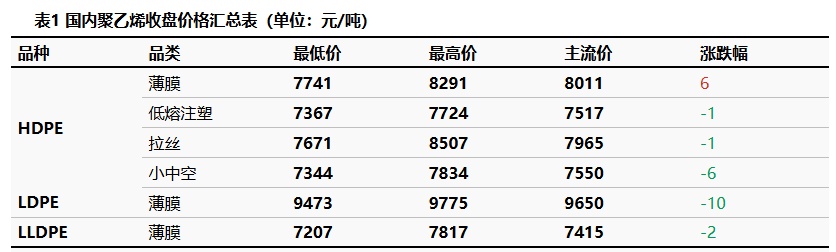
The support from the raw material cost side has weakened, leading some manufacturers to reduce their ex-factory prices. Market sentiment has weakened, with prices mainly declining as the market follows suit. Downstream factories are replenishing inventories at low prices, resulting in certain transactions at lower prices. The HDPE market price fluctuated by -6 to 6 yuan/ton, the LDPE market price by -10 yuan/ton, and the LLDPE market price by -2 yuan/ton.
3 ======== translates to "futures-spot basis."
The main LL contract fluctuated upwards, opening at 7,225 yuan/ton. As of 15:00, the closing price was 7,245 yuan/ton, an increase of 21 yuan compared to the previous settlement price. The trading volume was 225,200 contracts, and the open interest was 505,500 contracts. Today's futures-spot basis was -105 yuan/ton, compared to -20 yuan/ton on the previous working day.
4 Production Dynamics
Capacity utilization rate by 81.05% changed to 78.39%. Oil-based cost is 7534 RMB/ton; oil-based profit is -284 RMB/ton; coal-based profit is 880 RMB/ton.
|
Figure 3 Domestic Polyethylene Capacity Utilization Rate Trend |
Figure 4 Comparison of Domestic Polyethylene Profit and Price (Yuan/Ton) |
![[PE日评]:供应压力有所增强,价格下跌为主(20250903)](https://oss.plastmatch.com/zx/image/f37b8a74c7464e4f887e654199cb455b.png "[PE日评]:供应压力有所增强,价格下跌为主(20250903)") |
![[PE日评]:供应压力有所增强,价格下跌为主(20250903)](https://oss.plastmatch.com/zx/image/81ecd0a945a44ab8a689a154020db46f.png "[PE日评]:供应压力有所增强,价格下跌为主(20250903)") |
| Data source: Longzhong Information |
Data source: Longzhong Information |
5 Market sentiment
Table 2 Sentiment Expectations of Domestic Polyethylene Upstream and Downstream Practitioners

6. Price Forecast
In the short term, On the supply side, company maintenance has increased, while spot import resources have also increased, leading to a potential rise in inventory. On the demand side, downstream industries are gradually entering the traditional peak season, and orders for product companies have somewhat recovered, though there is no significant increase. Therefore, it is expected that the polyethylene market may experience narrow fluctuations next week. 。
7. Related Product Information
Crude Oil Market: The main trading logic of the international crude oil market has not changed. The positive factors come from the continuation of U.S. sanctions policies against oil-producing countries and geopolitical uncertainties, while the negative factors are OPEC+ maintains its stance on increasing production amid a weak global economy. Although it is still uncertain whether OPEC+ will initiate a new production increase plan, market concerns have already been reflected. With worries about the risk of oversupply, it is expected that... Next week International oil prices are expected to show a downward trend.
8. Data Calendar
Table 3 Domestic Polyethylene Data Overview Table (Unit: 10,000 tons)
|
Data |
Publication Date |
Previous Data |
The trend for this period is expected |
|
PE production enterprises total inventory (10,000 tons) |
Wednesday 17:00PM |
45.08 |
↘ |
|
PE Social Sample Warehouse Inventory |
Tuesday 17:00PM |
-0.27% |
↘ |
|
PE Weekly Production (10,000 tons) |
Thursday 17:00PM |
63.25 |
↗ |
|
PE maintenance impact volume (10,000 tons) |
Thursday 17:00PM |
12.33 |
↘ |
|
PE Weekly Capacity Utilization Rate |
Thursday 17:00PM |
80.55% |
↗ |
|
PE downstream industry capacity utilization rate |
Thursday 17:00PM |
0.80% |
↗ |
|
PE Mindset Survey |
Thursday 12:00AM |
-0.99% |
↘ |
|
Data source: Longzhong Information Remarks: 1. ↓↑ is regarded as a significant fluctuation, highlighting data dimensions with an increase or decrease of more than 3%. 2. ↗↘ are considered narrow fluctuations, highlighting data with a rise or fall within 0-3%. The above data is updated every Thursday. |
|||
【Copyright and Disclaimer】The above information is collected and organized by PlastMatch. The copyright belongs to the original author. This article is reprinted for the purpose of providing more information, and it does not imply that PlastMatch endorses the views expressed in the article or guarantees its accuracy. If there are any errors in the source attribution or if your legitimate rights have been infringed, please contact us, and we will promptly correct or remove the content. If other media, websites, or individuals use the aforementioned content, they must clearly indicate the original source and origin of the work and assume legal responsibility on their own.
Most Popular
-

AI Computing Power Demand Ignites Electronic Fabrics! China Jushi Hits Limit Up! Domestic Substitution Welcomes Golden Window
-

Focus on going global! kingfa sci. leads, huitong, preter, and kumho nire follow, china’s modified plastics frenziedly expanding worldwide
-

Back-to-back major joker moves! covestro’s 1.32 million ton mdi dual-line expansion and hdi acquisition reshape global polyurethane landscape
-

Evonik Parts Ways With The Polyester Business! A Strategic Retreat By A Germany Chemical Giant And The Global Industry Shift
-

PA66 Cost and Profit: Broad-Based Weakness in the Feedstock Market Continues to Erode Cost Support for PA66 (202606)


