


PC prices hit a five-year low! Bisphenol A costs break even line, 'giving up profits to survive' becomes an open secret in the industry.
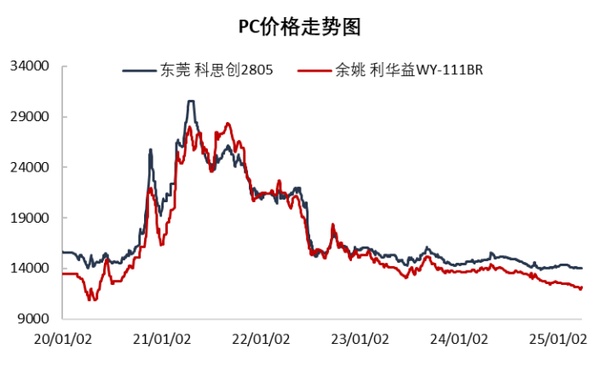
Since 2025, the domestic polycarbonate (PC) market has experienced significant price fluctuations under the dual pressure of supply and demand imbalance and cost reduction.. Especially inIn mid-March 2025, the decline in the PC market further widened, hitting a new low since the second half of 2020. Taking Huadong Lihua Yi WY-111BR as an example, the average price in the first quarter was 12,396 yuan/ton, a decrease of 3.28% quarter-on-quarter and 10.02% year-on-year.
One, Supply and Demand Imbalance: High Capacity Utilization Rates and Weak Downstream Demand
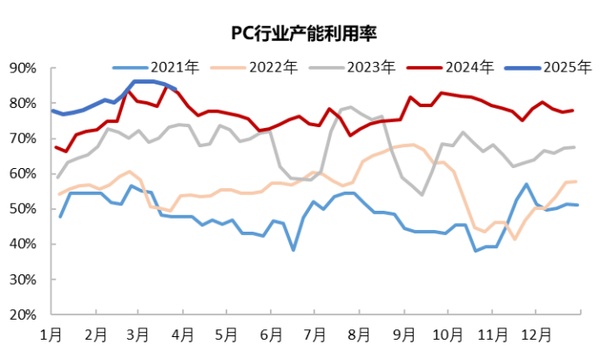
In 2025, the domestic PC industry's capacity utilization rate continued to operate at a high level, with a substantial capacity base and production reaching new highs. As of March 2025, the total capacity of the domestic PC industry remained at 3.81 million tons per year, and the industry's average operating rate rose to 84.75% in March.The weekly output is approaching.70,000 tons, the market supply is highly abundant. The operating load of PC has also reached the highest point in nearly five years. In addition, the 180,000 tons/year PC facility of Zhangzhou Chi Mei is scheduled to start operating in March, further increasing the total domestic PC production capacity and supply.
However, in sharp contrast to the strong growth on the supply side, downstream demand appears weak. Before the Spring Festival, apart from the modified industry where orders and purchases were relatively strong, other industries mostly stopped work and took holidays early. After the Spring Festival holiday, the demand from major consumer industries started to recover more slowly than expected.In March, there is still no improvement. The new order volume from downstream terminal factories is limited, leading to a noticeable slowdown in inventory consumption, which mainly relies on consuming previous stock levels. The operating rate of small and medium-sized factories is only 0-60%. Against the backdrop of abundant supply, the limited rigid demand from downstream buyers is more passive and cautious, resulting in poor market transactions and increasing pressure of imbalance between production and sales in the industry.
II. Cost decline: Raw material prices have dropped significantly.
Bisphenol in the first quarter Market A overall showed a downward trend from a high position. In March, as international crude oil prices plummeted, energy chemical product prices continued to decline. The upstream of the industry chain, pure benzene, started a rapid price drop mode, and raw materials such as phenol and bisphenol A also decreased to varying degrees following the cost, weakening the cost support for PC. In March, the average price of bisphenol A in East China was 9,350 yuan/ton, a year-on-year decrease of 1.98%, further weakening the cost support for the PC industry. The industry's theoretical gross profit once fell into a loss. In late March, PC factories gradually became cautious about low selling intentions. As the price of bisphenol A fell, the PC gross profit level gradually recovered.
Future Market Outlook: Weak Consolidation as the Main Theme
From the supply side, despite Luxi ChemicalOne production line of the PC facility remains shut down, but the overall operations of other domestic PC facilities remain stable. In April, the PC facilities of Pingmei Shenma, Cangzhou Dadi, and Sino-Saudi Tianjin all have scheduled maintenance outages planned, leading to a temporary reduction in industry-wide capacity utilization to around 75%. As market supply decreases, sellers may maintain their price expectations, which could potentially lead to a bottoming out of the PC market. However, downstream terminal demand is unlikely to improve significantly in the short term, exacerbating the supply-demand imbalance. Weak demand limits the upward movement of quotations, making it difficult for merchants to maintain firm prices, leaving room for potential discounting to promote transactions.
Author:Zhao Hongyan,Specialized Plastic Vision Market Research Expert
【Copyright and Disclaimer】This article is the property of PlastMatch. For business cooperation, media interviews, article reprints, or suggestions, please call the PlastMatch customer service hotline at +86-18030158354 or via email at service@zhuansushijie.com. The information and data provided by PlastMatch are for reference only and do not constitute direct advice for client decision-making. Any decisions made by clients based on such information and data, and all resulting direct or indirect losses and legal consequences, shall be borne by the clients themselves and are unrelated to PlastMatch. Unauthorized reprinting is strictly prohibited.
Most Popular
-

AI Computing Power Demand Ignites Electronic Fabrics! China Jushi Hits Limit Up! Domestic Substitution Welcomes Golden Window
-

Focus on going global! kingfa sci. leads, huitong, preter, and kumho nire follow, china’s modified plastics frenziedly expanding worldwide
-

Back-to-back major joker moves! covestro’s 1.32 million ton mdi dual-line expansion and hdi acquisition reshape global polyurethane landscape
-

Evonik Parts Ways With The Polyester Business! A Strategic Retreat By A Germany Chemical Giant And The Global Industry Shift
-

PA66 Cost and Profit: Broad-Based Weakness in the Feedstock Market Continues to Erode Cost Support for PA66 (202606)


