


[pc daily review] market stabilizes with a wait-and-see approach
1 Today's Summary
①. Week Four International crude oil Decline , ICE Brent crude futures for November contract at 66.99, down 0.61 USD/barrel.
②、 The closing price of bisphenol A in the East China market is 8,000. Yuan/ton, an increase of 25 yuan/ton compared to the previous period.
③. A PC factory in Shandong raised its bid by 100 yuan/ton.
2 Spot Overview
Table 1: Summary of Domestic PC Prices (Unit: Yuan/Ton)
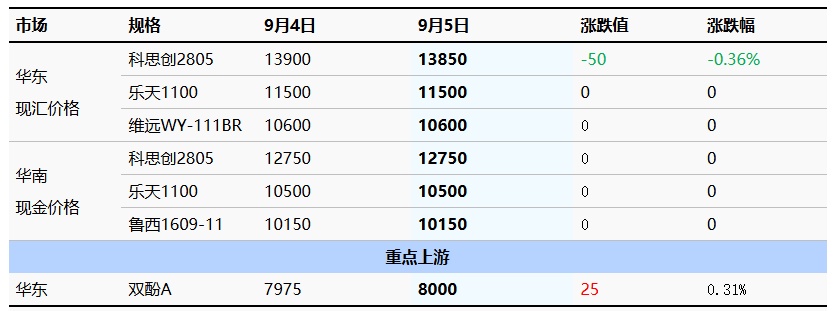
The domestic PC market remained quiet and steady today. By the afternoon closing, the mainstream negotiation reference for East China injection molding grade low-end materials was 9,600-13,450 yuan/ton, while middle to high-end materials were discussed at 13,850-15,300 yuan/ton, with the overall focus remaining roughly stable compared to yesterday. Approaching the weekend, most domestic PC factories have not announced any new ex-factory price adjustments. However, a PC factory in Shandong has raised its auction price by 100 yuan/ton. In the spot market, both East China and South China are operating steadily and quietly. Although raw material prices continue to rise, increasing cost pressures on the industry, production enterprises currently have no plans to actively reduce production or supply. Meanwhile, downstream demand remains weak, and industry players are cautiously observing the market, maintaining stable operations with light trading.
|
Figure 1: Price Trend Chart of the East China PC Market (Unit: Yuan/Ton) |
Figure 2 Domestic PC Price Trend Chart by Region (Unit: Yuan/Ton) |
|
|
|
|
Data Source: Longzhong Information |
Data Source: Longzhong Information |
![[PC日评]:市场清淡整理为主,局部仍有窄跌(20250905)](https://oss.plastmatch.com/zx/image/1f998e9663f84b5f989bbfb58e2f4fa2.png "[PC日评]:市场清淡整理为主,局部仍有窄跌(20250905)")
![[PC日评]:市场清淡整理为主,局部仍有窄跌(20250905)](https://oss.plastmatch.com/zx/image/ca9d452c71fc4257b5bf7f311219c744.png "[PC日评]:市场清淡整理为主,局部仍有窄跌(20250905)")
3 Production Dynamics
Today, the capacity utilization rate of domestic PC factories is 79.37%; the price of raw material BPA in the East China market has increased by 25 yuan/ton to 8,000 yuan/ton, and the gross profit level of the domestic PC industry has decreased by 22.5 yuan/ton compared to the previous working day, standing at -1,100 yuan/ton.
|
Figure 3: Domestic PC Weekly Capacity Utilization Trend Chart |
Figure 4 Comparison Chart of Domestic PC Profit and Price (Unit: Yuan/Ton) |
|
|
![[PC日评]:市场清淡整理为主,局部仍有窄跌(20250905)](https://oss.plastmatch.com/zx/image/b4d66d9f4c91477c92f2f84ee91d55be.png "[PC日评]:市场清淡整理为主,局部仍有窄跌(20250905)") |
|
Data Source: Longzhong Information |
Data Source: Longzhong Information |
![[PC日评]:市场清淡整理为主,局部仍有窄跌(20250905)](https://oss.plastmatch.com/zx/image/775fb75c39f64fcab483956d4fbda721.png "[PC日评]:市场清淡整理为主,局部仍有窄跌(20250905)")
4 Price Prediction
This week, the raw material bisphenol A has continued to rise, increasing the cost pressure on PC. The market is in a strong wait-and-see atmosphere, with some intentions to support prices. However, there are currently no plans for production cuts or maintenance for PC facilities, and with the restart of maintenance facilities, the supply side is increasing rather than decreasing. Meanwhile, there has been no significant improvement in the follow-up of downstream demand. It is expected that the domestic PC market will operate in a narrow range of low-level consolidation in the short term, with attention on further price adjustments by major PC manufacturers and changes in market sentiment.
5 ", Related Product Information"
Bisphenol A Market In the East China region, bisphenol A closed at 8,000 RMB/ton today, within the range of 8,000-8,000 RMB/ton, an increase of 25 RMB/ton compared to yesterday, in line with morning expectations. The East China bisphenol A market experienced a narrow increase today, with East China producers raising their listed prices by 100 RMB/ton in the morning, boosting market sentiment. However, as the weekend approaches, downstream inquiries were sluggish with limited buying interest, and the extent of price increases offered by holders was not significant, resulting in a limited rise in the focus of actual transaction negotiations. 。
6 Data Calendar
Table 2: Overview of Domestic PC Data (Unit: Yuan/Ton)
|
Data |
Publication Date |
Previous data |
Current Trend Forecast |
|
Capacity utilization rate |
Thursday 4:30 PM |
79.37% |
↗ |
|
Weekly PC Profit |
Thursday 4:00 PM |
-933.5 |
↘ |
|
Data source: Longzhong Information Remark: 1. Consider a significant fluctuation as a large wave, highlighting data dimensions with a change exceeding 3%. 2. ↗↘ is considered a narrow fluctuation, highlighting data with a rise or fall of within 0-3%. |
|||
【Copyright and Disclaimer】The above information is collected and organized by PlastMatch. The copyright belongs to the original author. This article is reprinted for the purpose of providing more information, and it does not imply that PlastMatch endorses the views expressed in the article or guarantees its accuracy. If there are any errors in the source attribution or if your legitimate rights have been infringed, please contact us, and we will promptly correct or remove the content. If other media, websites, or individuals use the aforementioned content, they must clearly indicate the original source and origin of the work and assume legal responsibility on their own.
Most Popular
-

AI Computing Power Demand Ignites Electronic Fabrics! China Jushi Hits Limit Up! Domestic Substitution Welcomes Golden Window
-

Focus on going global! kingfa sci. leads, huitong, preter, and kumho nire follow, china’s modified plastics frenziedly expanding worldwide
-

Back-to-back major joker moves! covestro’s 1.32 million ton mdi dual-line expansion and hdi acquisition reshape global polyurethane landscape
-

Evonik Parts Ways With The Polyester Business! A Strategic Retreat By A Germany Chemical Giant And The Global Industry Shift
-

PA66 Cost and Profit: Broad-Based Weakness in the Feedstock Market Continues to Erode Cost Support for PA66 (202606)


