


Ningbo Institute of Technology, Zhejiang University: Optimization and Verification of Warpage Deformation of Automotive Front-End Framework Based on GA-BP Algorithm
1 Front-end framework structure model
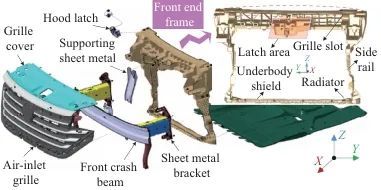
1.1 Product Structure
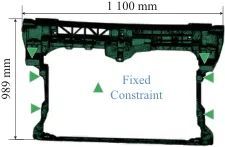
1.2 Finite Element Model
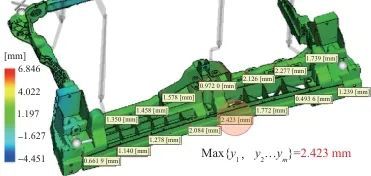
1.3 Warp Deformation Analysis
2 Orthogonal Test Method
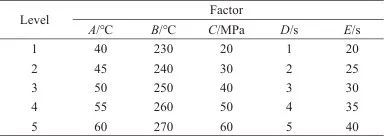
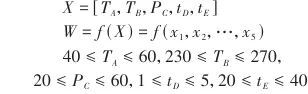
2.1 Orthogonal Experiment Design
Table 1 Process parameters and levels under orthogonal test
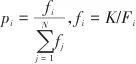
2.2 Orthogonal Test Results
Table 2 Process parameter and warping result of orthogonal test
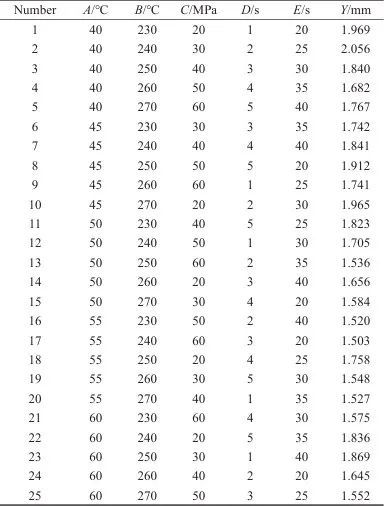
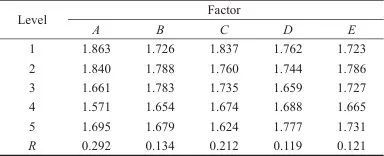
Table 3 Result analysis of range
 |
(1) |
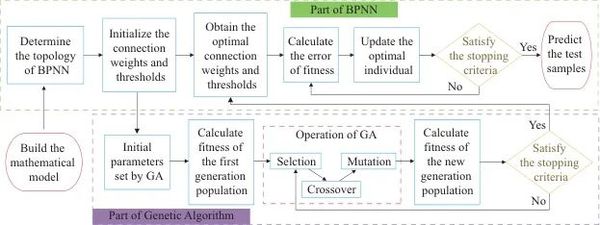
3 Optimization of Process Parameters Based on Intelligent Algorithms
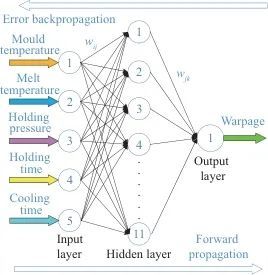
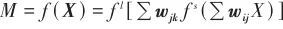
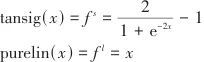
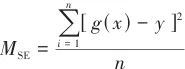
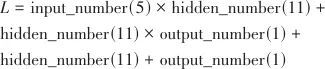
3.1 BP Neural Network Construction
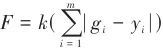
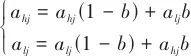
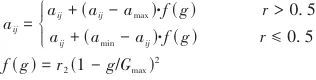
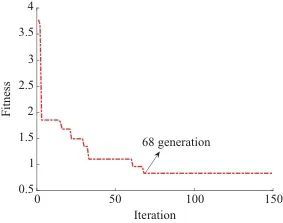
3.2 GA Algorithm Optimization
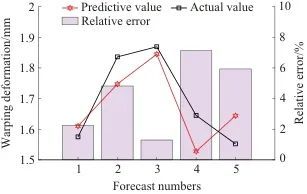
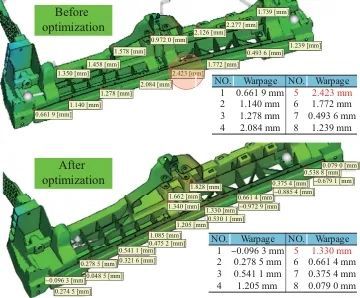
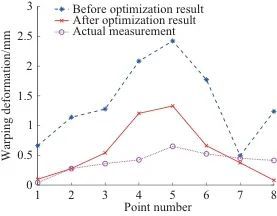
4 result verification
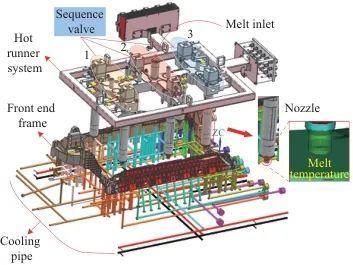
4.1 Moldflow Numerical Simulation Verification
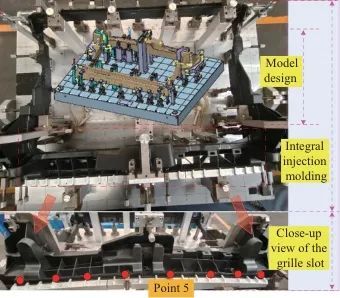
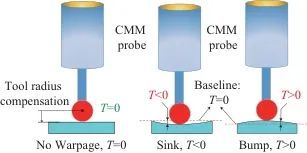
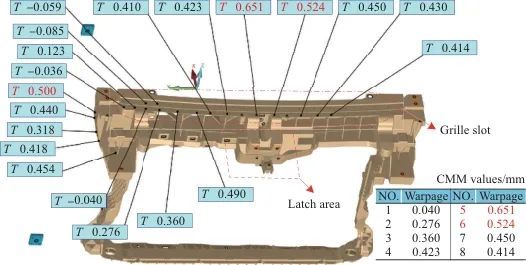
4.2 CMM experimental verification
5 Conclusion
【Copyright and Disclaimer】The above information is collected and organized by PlastMatch. The copyright belongs to the original author. This article is reprinted for the purpose of providing more information, and it does not imply that PlastMatch endorses the views expressed in the article or guarantees its accuracy. If there are any errors in the source attribution or if your legitimate rights have been infringed, please contact us, and we will promptly correct or remove the content. If other media, websites, or individuals use the aforementioned content, they must clearly indicate the original source and origin of the work and assume legal responsibility on their own.
Most Popular
-

AI Computing Power Demand Ignites Electronic Fabrics! China Jushi Hits Limit Up! Domestic Substitution Welcomes Golden Window
-

Focus on going global! kingfa sci. leads, huitong, preter, and kumho nire follow, china’s modified plastics frenziedly expanding worldwide
-

Back-to-back major joker moves! covestro’s 1.32 million ton mdi dual-line expansion and hdi acquisition reshape global polyurethane landscape
-

Evonik Parts Ways With The Polyester Business! A Strategic Retreat By A Germany Chemical Giant And The Global Industry Shift
-

PA66 Cost and Profit: Broad-Based Weakness in the Feedstock Market Continues to Erode Cost Support for PA66 (202606)


