


Never expected that the collapse of plastic prices would be even more dramatic than that of packaging paper.
After the collapse of packaging paper prices, plastic raw material prices have also crashed!
From the "6" mark straight down to the "4" mark, PVC plummeted by 1360 yuan in less than a year!
The entire market is collapsing, and the PE market can't hold on either! Making ten thousand yuan from three truckloads of waste plastic, now it's all for nothing!
Plastic manufacturers secretly resumed production during the Spring Festival, Trump wielded tariff sanctions, India aggressively blocked BIS certifications, international crude oil prices crashed... Faced with overflowing inventory, dealers had no choice but to sell at a loss and exit the market.
Now that crude oil is plummeting with new materials, it's squeezing the price of regenerated materials, causing the price of regenerated materials to crash, which directly affects the price of recycled raw materials! Everything is falling apart!
Plastic prices plummet
The price of PVC has accelerated in the afternoon, dropping from the "6" range last May to the "5" range, and now it has even reached the "4" range. In less than a year, it has decreased by 1360 yuan!
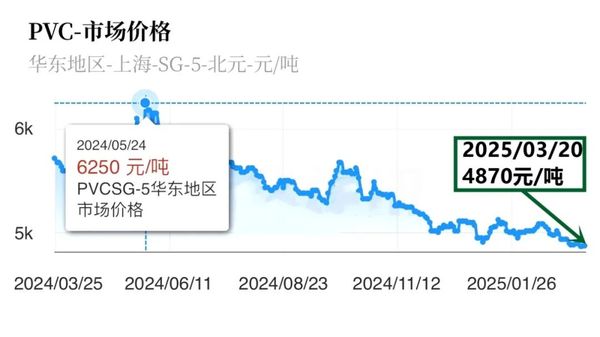
Currently, the global PVC market is in a race to see who is worse off, with China’s main port FOB prices plummeting like a roller coaster. Manufacturers are struggling with excess inventory, and they can only cut their losses through massive discounts.
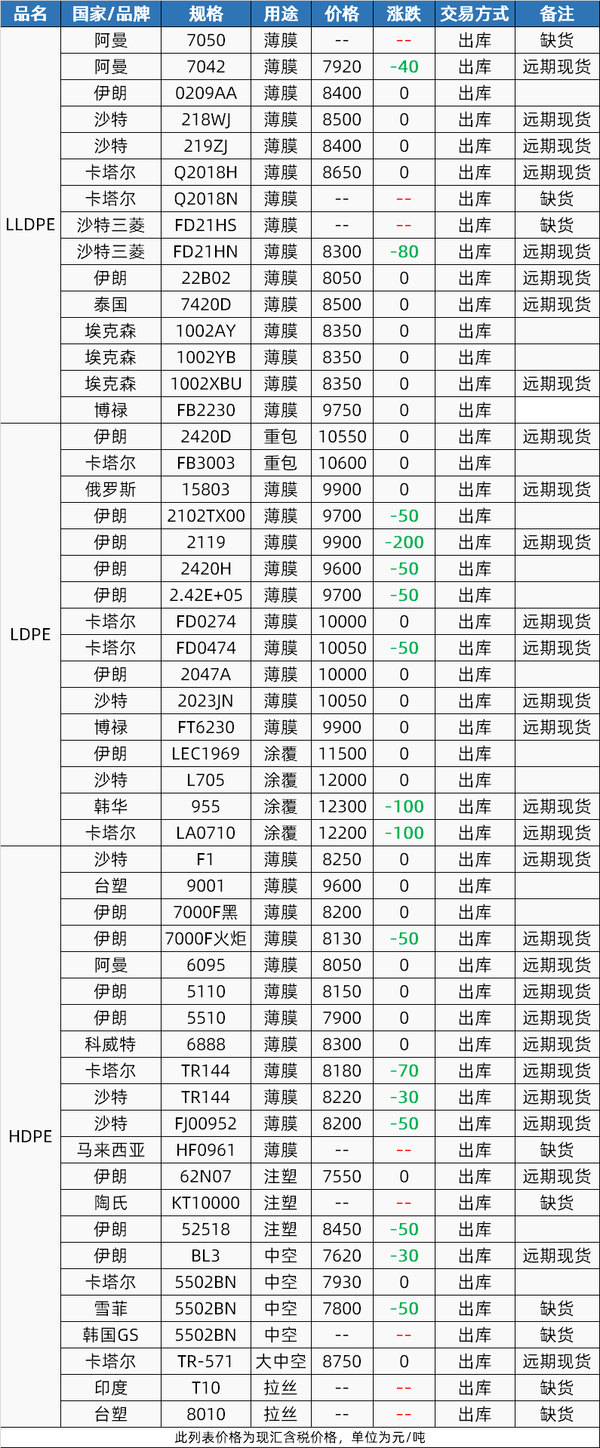
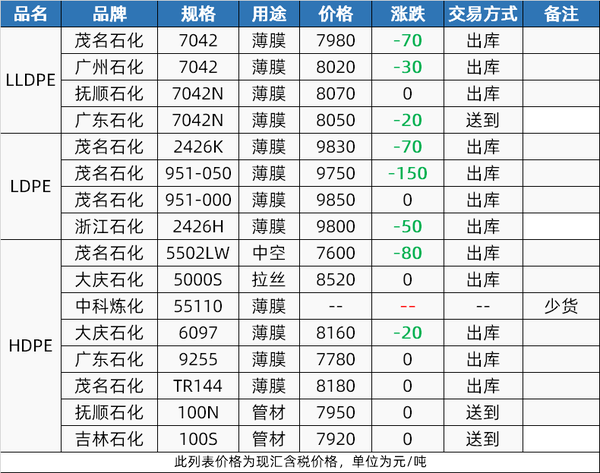
In the PE market, both imported and domestic materials continued to decline across the board, with a slightly larger drop in imported materials. In the Shanghai market, LDPE/Iran/2119 fell by 200 yuan/ton in a single day, while in the Dongguan market, domestic LDPE/Maoming Petrochemical/951-050 dropped by 150 yuan/ton daily.
March 21 Shanghai Import PE Market Price
March 21 Dongguan PE Market Price
Multiple adversities intertwined in a predicament
The direct cause of this price reduction in the short term is the result of the resonance between oversupply and suppressed demand.
In the first quarter, it was expected to be the maintenance season for global PVC, but in reality, manufacturers were secretly operating, putting on a farce of trying to cover up but making it more obvious.
On the demand side, market activity has been sluggish due to the impact of Trump's tariff policies and India's BIS certification restrictions.
In the long run, China's crazy production capacity may have a profound impact on the global plastic industry. We have to say that we projected the country's crazy infrastructure construction onto the global manufacturing sector, and the mad expansion of production capacity has led to an imbalance between global supply and demand.
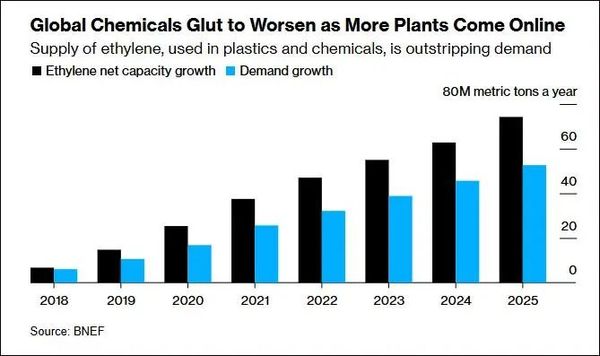
Crazy capacity expansion
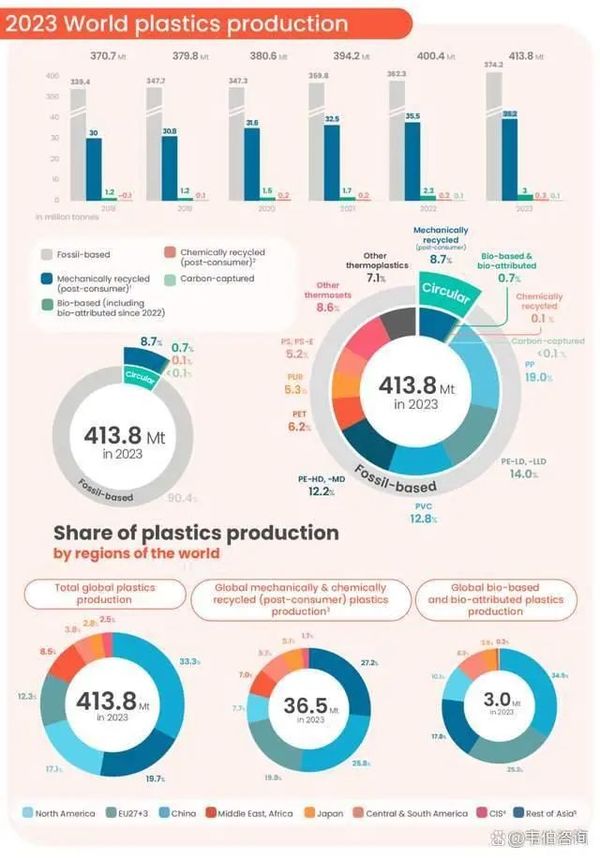
In 2023, the total global plastic production was 413.8 million tons, with China accounting for 33.3% of the total plastic production. Other regions in Asia (excluding China and Japan) accounted for 19.7%, North America accounted for 17.1%, the EU 27+3 accounted for 12.3%, the Middle East and Africa accounted for 8.5%, Central and South America accounted for 3.8%, and Japan accounted for 2.8%.
BloombergNEF analyst Philip Gertz stated that global production capacity for chemicals such as ethylene and propylene is expected to grow at a near-record level this year, with the vast majority of this expansion occurring in China. Since 2020, China's polyethylene market has experienced a second wave of capacity expansion. According to JLC Network statistics, China's polyethylene production capacity in 2024 remains dominated by oil-based feedstocks, with planned new installations totaling 1.5 million tons within the year. Additionally, 3.4 million tons of new capacity is set to come online in 2024.
Global degradable plastic capacity was approximately 1.7 million tons in 2023, with China's capacity at 1.28 million tons, accounting for 75% of global capacity. According to predictions by the China Plastics Processing Industry Association (CPPIA), China's total biodegradable plastic capacity is expected to exceed 6.5 million tons by 2025.
As of April 2023, China's annual production capacity of PBAT has reached approximately 1.3 million tons, with an output of about 120,000 tons, and the industry scale's annual growth rate is as high as 89%. Currently, the scale of PLA projects under planning and construction has approached 3.4 million tons/year, and the expected industry growth rate will reach around 90%.
Facing the global wave of plastic bans and restrictions, the plastic industry has not only failed to reduce production capacity but has instead expanded against the trend. As you sow, so shall you reap—what goes around comes around. A price collapse is naturally inevitable sooner or later!
【Copyright and Disclaimer】The above information is collected and organized by PlastMatch. The copyright belongs to the original author. This article is reprinted for the purpose of providing more information, and it does not imply that PlastMatch endorses the views expressed in the article or guarantees its accuracy. If there are any errors in the source attribution or if your legitimate rights have been infringed, please contact us, and we will promptly correct or remove the content. If other media, websites, or individuals use the aforementioned content, they must clearly indicate the original source and origin of the work and assume legal responsibility on their own.
Most Popular
-

AI Computing Power Demand Ignites Electronic Fabrics! China Jushi Hits Limit Up! Domestic Substitution Welcomes Golden Window
-

Focus on going global! kingfa sci. leads, huitong, preter, and kumho nire follow, china’s modified plastics frenziedly expanding worldwide
-

PA66 Cost and Profit: Broad-Based Weakness in the Feedstock Market Continues to Erode Cost Support for PA66 (202606)
-

Back-to-back major joker moves! covestro’s 1.32 million ton mdi dual-line expansion and hdi acquisition reshape global polyurethane landscape
-

Evonik Parts Ways With The Polyester Business! A Strategic Retreat By A Germany Chemical Giant And The Global Industry Shift


