


[Monthly Report on Special Plastics] Macro/Crude Oil: Domestic Core CPI Growth Continues to Expand, Oil Prices Are More Likely to Fall Than Rise After Peak Season Ends
Macroscopic Overview
Overseas: After the September FOMC meeting, the Federal Reserve announced a 25 basis point cut in the federal funds rate, adjusting it to the 4.00%-4.25% range, with the balance sheet reduction plan remaining unchanged, overall in line with market expectations.
The overall message of this meeting conveys a policy orientation of "cautious easing." Powell emphasized that the current "uncertainty regarding the economic outlook remains high" and pointed out that "downside risks to employment have increased," which is a new statement compared to the past, reflecting concerns about the labor market. However, he also noted that "inflation indicators have recently rebounded and remain in a relatively high range," indicating that the Federal Reserve remains highly vigilant about price levels while pursuing easing. Overall, in the context of the "dilemma" of pressure on employment and persistent inflation, the Federal Reserve has shifted towards easing but maintains a cautious stance.
The ZEW Economic Sentiment Index for the Eurozone rose in September. Following the onset of a "big fiscal" era in important countries like Germany, the economic outlook for Europe has significantly improved, continuing its recovery.
In August, China's economy was still characterized by a "strong supply, weak demand" pattern. The industrial added value grew by 5.2% year-on-year, which, although a 0.5 percentage point decrease from July, remained at a relatively high level. The added value of high-tech industries increased by 9.3% year-on-year, maintaining a high growth rate, reflecting the ongoing industrial upgrading in China and the continuous increase in the contribution of high-tech industries to the economy.
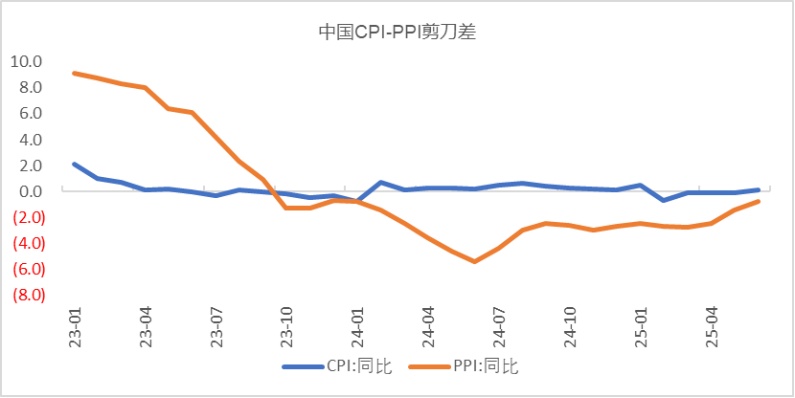
The growth of the domestic core CPI continues to expand, and the PPI shows positive improvement, reflecting the gradual effectiveness of the domestic anti-involution policies. As these policies continue to take effect, it is expected that domestic prices will show a gradual improvement trend. Additionally, with the path of U.S. interest rate cuts becoming clearer, this provides more flexibility for domestic monetary policy.
Oil Prices: This month, crude oil prices have remained within a range of fluctuations, primarily influenced by several factors. On the supply side, OPEC+ decided to further increase production by 547,000 barrels per day in September, completing its plan to restore 2.2 million barrels per day ahead of schedule. This marks a shift in its strategic focus from "price stabilization" to "market share," exacerbating expectations of a global oversupply in the oil market. However, geopolitical factors occasionally create risks of supply disruptions, making it difficult for oil prices to decline smoothly, leading to primarily pulse-like rebounds.
Detailed description of overseas markets
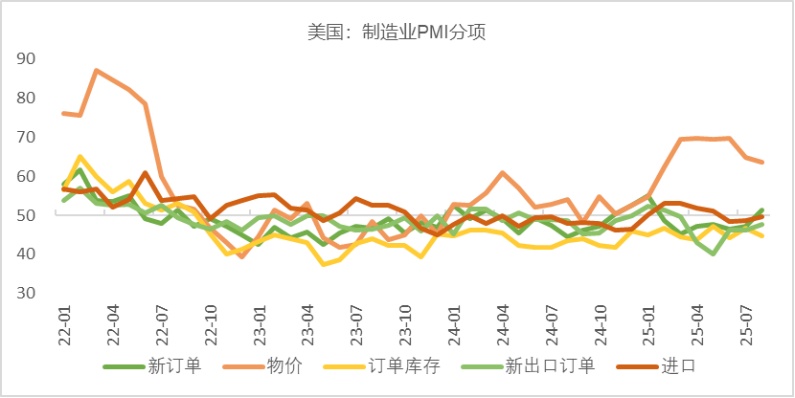
United States: The ISM Manufacturing PMI for August is 48.7, an increase of 0.7 percentage points from the previous month; it is below the market expectation of 49% and has contracted for six consecutive months, indicating that the manufacturing sector continues to be negatively impacted by cost increases driven by tariffs and rising uncertainty regarding tariffs.
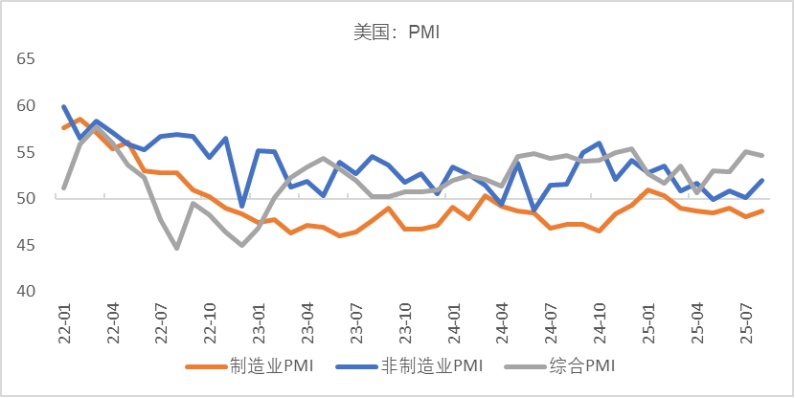
In terms of sub-indicators, both production and demand have significantly improved, but the contraction in employment has not shown obvious improvement, while prices continue to remain high (see the figure below).
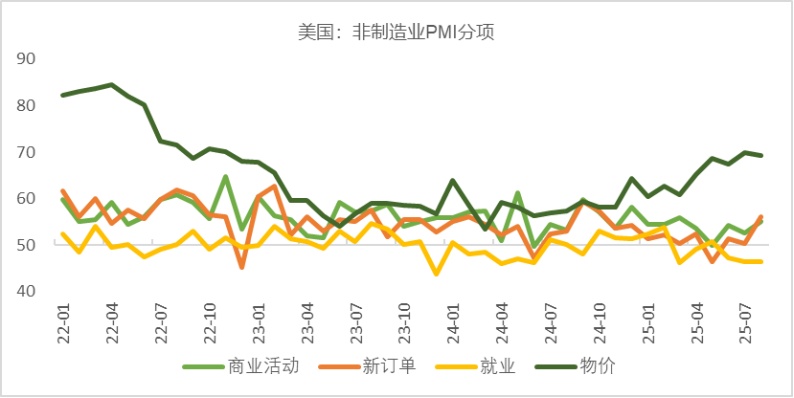
The ISM Non-Manufacturing PMI is 52%, an increase of 1.9 percentage points from last month, far exceeding the market expectation of 51% (see the chart below).
In August, the U.S. economic data showed some recovery, but the risk of stagflation remains. In the short term, the U.S. economy will continue to fluctuate due to the instability in the implementation of policies by the Trump administration.
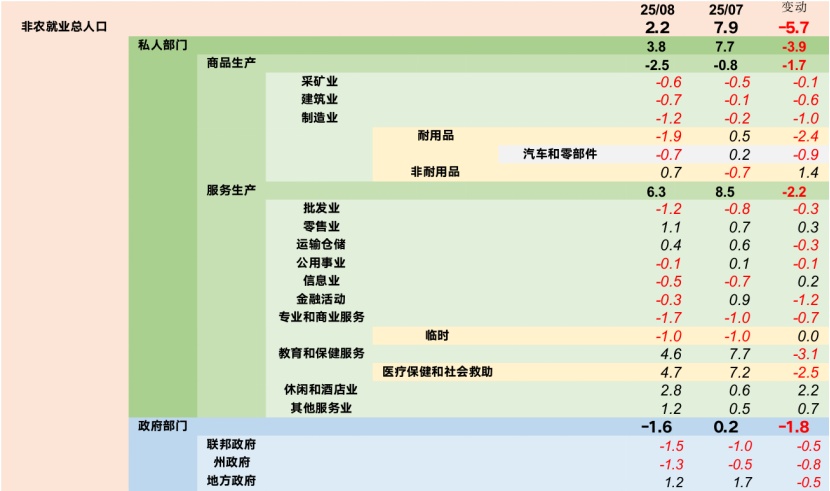
Employment: In August, the United States added 22,000 non-farm jobs, which was below the market expectation of 75,000. The unemployment rate rose by 0.1 percentage points to 4.3%, in line with market expectations. This month's non-farm data continues to show weakness, while the 2025 non-farm employment benchmark change has been revised from a previous value of -598,000 to -911,000, significantly lower than the expected value of -700,000, confirming that the U.S. job market has entered a state of weakness (see chart below).
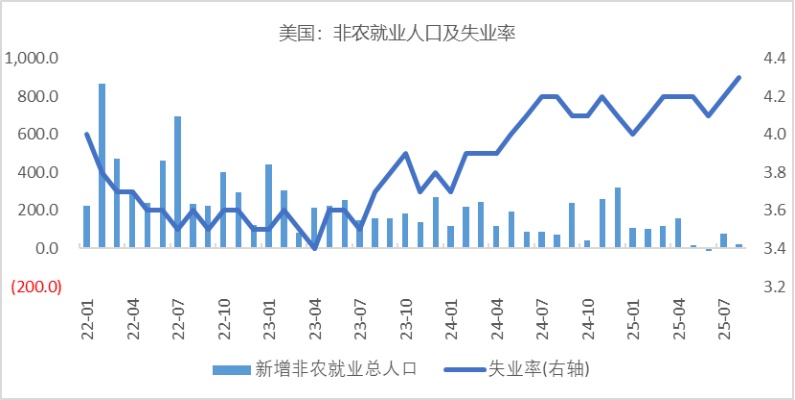
The economic data recovery is below expectations, and the non-farm payroll employment data is significantly lower than market expectations. The probability of the U.S. economy entering a recession is increasing. However, since prices remain at a high level, the inflation issue has not been effectively resolved. The Federal Reserve's monetary policy direction still needs to find a balance between controlling inflation and preventing economic recession.
The employment report for August, released on September 5, has deepened investors' concerns about the U.S. labor market and cleared the way for the Federal Reserve to make a decision on interest rate cuts in September. The rapid cooling of the current U.S. employment market is partly due to the widespread application of "AI replacing humans."
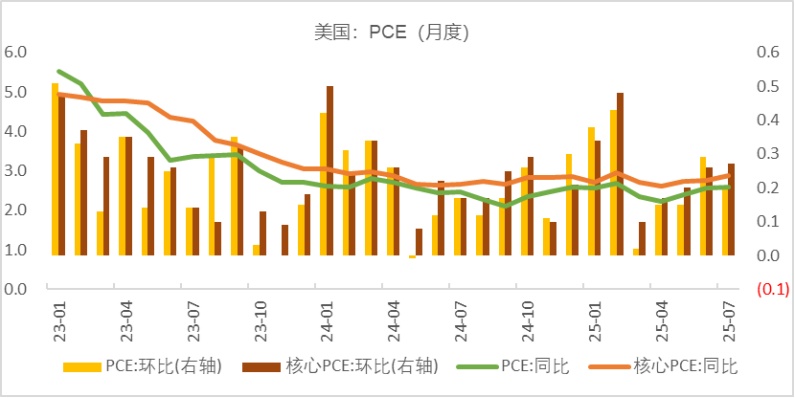
In terms of inflation: The latest published core PCE price index shows that the index rose by 2.9% year-on-year in July (in line with expectations but higher than the previous value of 2.8%); it increased by 0.3% month-on-month (in line with expectations and equal to the previous value). This inflation index is the one most closely monitored by the Federal Reserve.
The U.S. Department of Labor announced that the Consumer Price Index (CPI) for August rose by 2.9% year-on-year, accelerating by 0.2 percentage points compared to July, in line with market expectations. On a monthly basis, it increased by 0.4%, accelerating by 0.2 percentage points from July, slightly higher than the market expectation of 0.3%. During the period, the core CPI rose by 3.1% year-on-year and increased by 0.3% month-on-month, both remaining unchanged compared to July and also meeting market expectations.
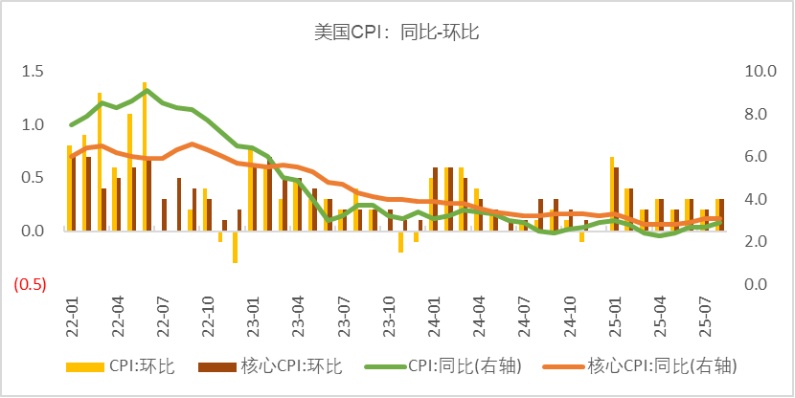
Although the overall annual growth rate of the US CPI has accelerated, the core CPI generally meets market expectations. Coupled with the PPI data being lower than market expectations, with its growth rate also slowing down, the market generally interprets this as not hindering the Fed's path to interest rate cuts. More importantly, the US Department of Labor revised down the number of non-farm jobs added in the 12 months ending in March this year by 911,000 compared to the original estimate, which is equivalent to an average monthly downward revision of about 76,000. This reflects a greater weakening trend in the US labor market than the Fed originally expected, which strengthens the expectation of more significant interest rate cuts in the US this year.
Europe: The Eurozone Composite PMI rose to 51.1, with the Manufacturing PMI breaking above 50, showing improvement from the manufacturing contraction since 2022, reflecting improvements in the supply chain and a rebound in demand. The Services PMI (50.7) saw a slight decline but still remains in expansion.
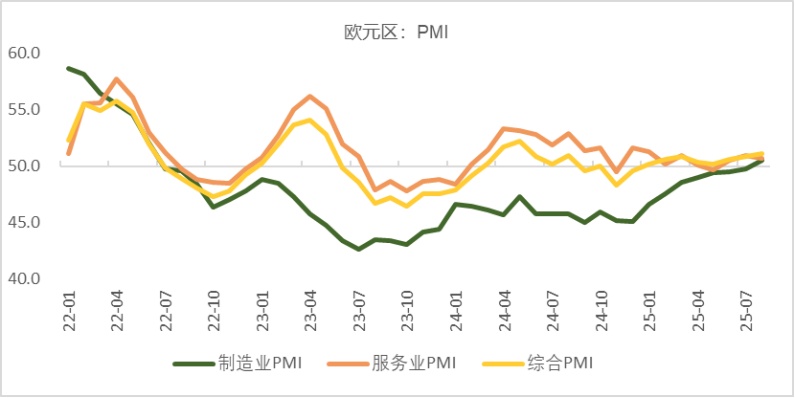
In August, as the trade dispute between the US and Europe eased initially, coupled with strong economic performance in Spain and Italy, it demonstrated that economic diversification is supportive. Employment has increased for six consecutive months, indicating that the labor market supports consumption and economic activity. The overall CPI in the Eurozone in August was 2.1% year-on-year, close to the target level; the core CPI was 2.3% year-on-year, the lowest level since January 2022. Based on expectations of substantial fiscal support and inflation near the target level, market expectations regarding whether the ECB (European Central Bank) will cut interest rates in September have become divided.
Detailed Description of the Domestic Market
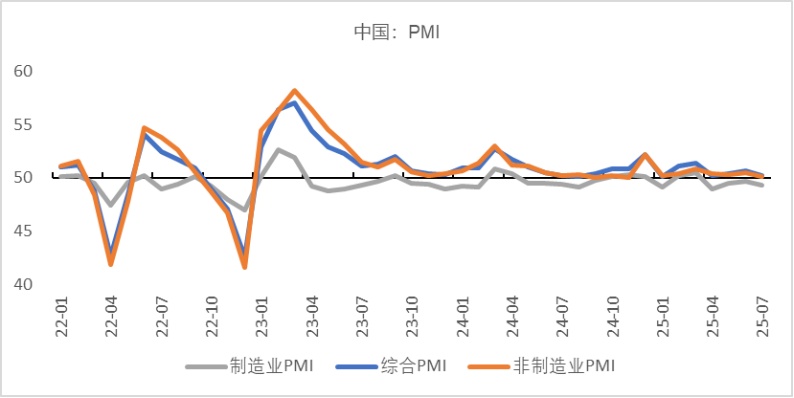
In August, the domestic manufacturing PMI was 49.4%, an increase of 0.1 percentage points from the previous month, with improvements observed in both production and demand. (See the figure below.)
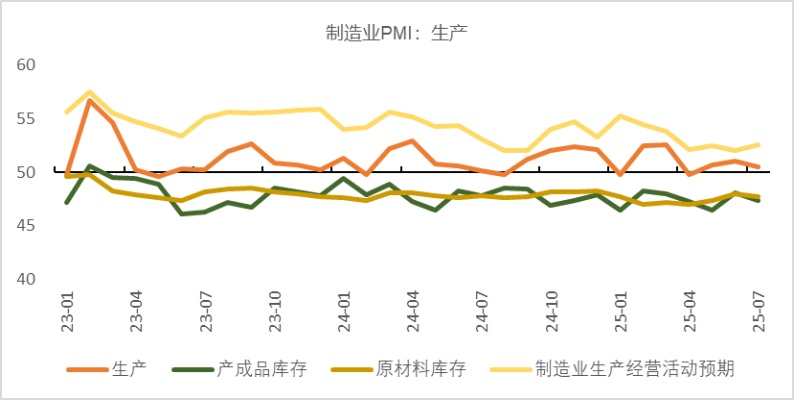
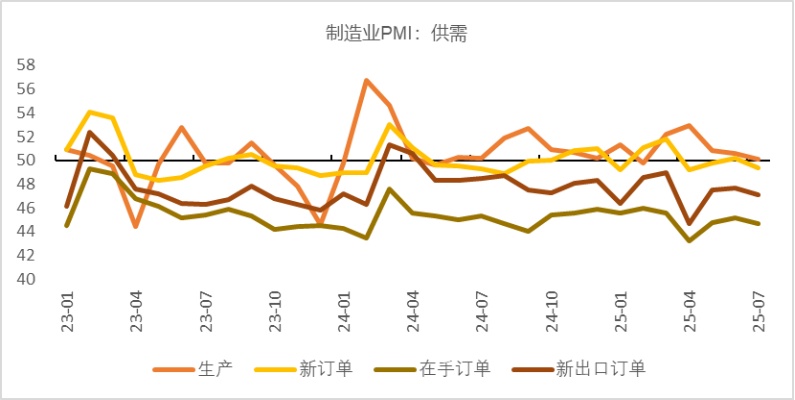
In terms of components: On the demand side, the new orders index rose by 0.1 percentage points to 49.5%, and the new export orders index also increased by 0.1 percentage points to 47.2%. Although both domestic and external demand have somewhat recovered, the strength of the recovery is weak. This is mainly due to the continuous weakening of the "rush export" effect and the overdraft on demand caused by the "trade-in" policy for consumer goods in the first half of the year. As we enter the second half of the year, growth on the demand side has shown signs of fatigue. On the supply side, the production index rose by 0.3 percentage points to 50.8%. Anti-involution policies have effectively promoted an improvement in price expectations, thereby driving an improvement in business expectations for production activities. (See the figure below).
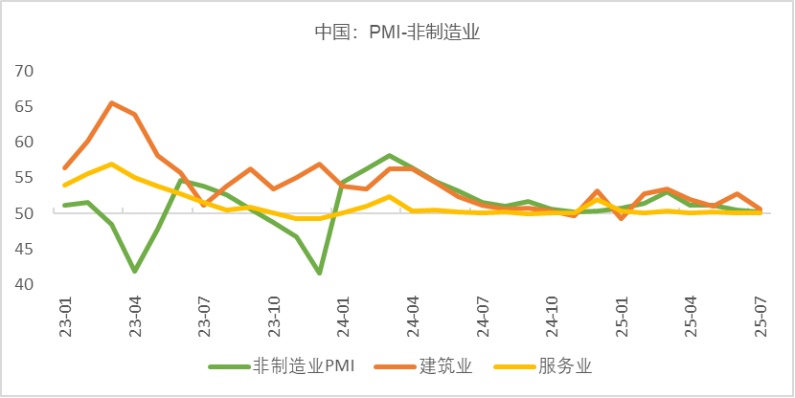
The domestic non-manufacturing PMI is 50.3%, an increase of 0.2 percentage points from the previous month, indicating a significant recovery in the services sector, while the construction sector continues to decline sharply. Among them, the services PMI rose by 0.5 percentage points to 50.5%, driven by an active capital market and the effects of the summer holiday. The business index for capital market services and tourism-related industries continues to expand, but the business activity sentiment related to real estate remains weak.
The construction industry PMI fell by 1.5 percentage points from the previous month to 49.1%. This month's significant decline is mainly due to the continued weakness in real estate demand affecting developers' construction progress, as well as recent unfavorable factors such as high temperatures and heavy rainfall that have also slowed down construction production.
Looking ahead, as current specific policy implementation shifts towards addressing risks in particular industries, optimizing the supply-demand structure in key sectors, and mitigating vicious competition within industries, there will be greater room for subsequent policies to stimulate economic development. The medium-term trend of China’s economic fundamentals remains a steady recovery, with the current "lower limit" of economic fundamentals essentially stabilized. The potential "upper limit" will depend on the stability of the global situation and the pace of breakthroughs in China's industries.
In terms of inflation, in August, the national consumer price index decreased by 0.4% year-on-year. Among them, urban areas saw a decrease of 0.3%, and rural areas saw a decrease of 0.6%; food prices fell by 4.3%, while non-food prices rose by 0.5%; consumer goods prices dropped by 1.0%, and service prices increased by 0.6%. (See the chart below).
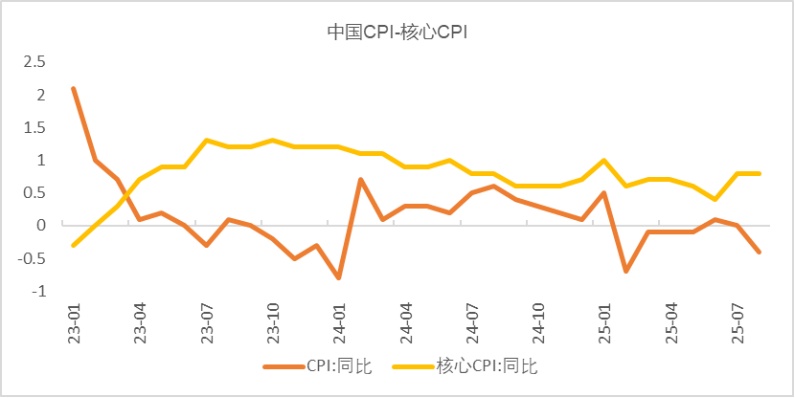
In terms of specific components, the CPI in August showed clear differentiation. The food component decreased by 4.3% year-on-year, down 2.7 percentage points from the previous month, contributing to the CPI turning negative year-on-year. The non-food component increased by 0.5% year-on-year, up 0.2 percentage points from the previous month, serving as a supportive factor for the CPI year-on-year. Excluding food and energy, the core CPI rose by 0.9% year-on-year in August, up 0.1 percentage points from the previous month, marking the fourth consecutive month of accelerating growth and the highest value since March 2023. On a month-on-month basis, it remained unchanged at 0.0%, down 0.4 percentage points from the previous month, roughly aligning with the seasonal pattern (-0.02%). (See the chart below.)
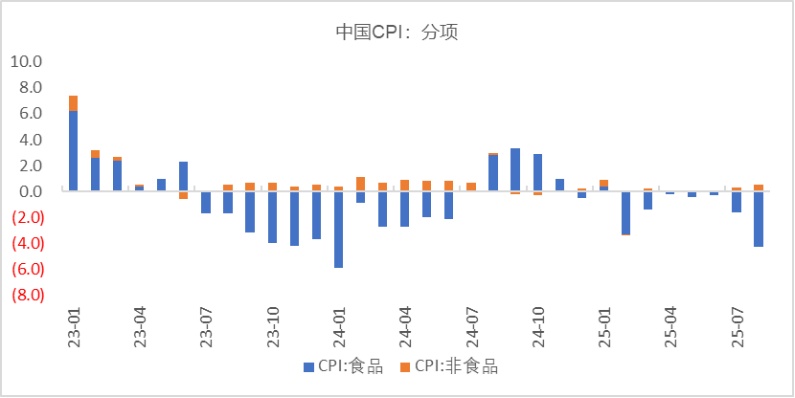
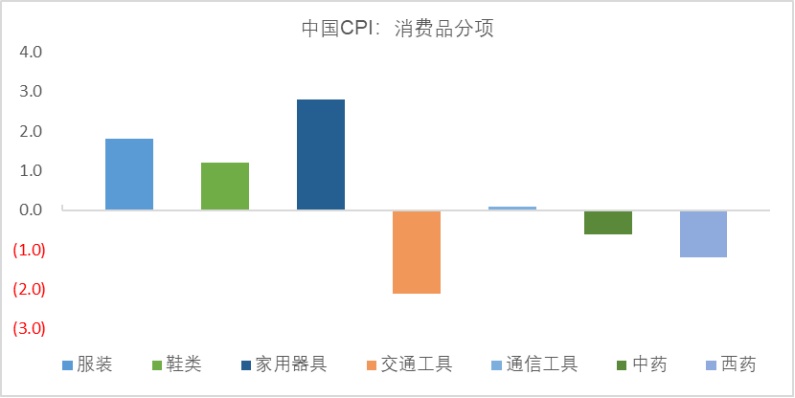
In August, the month-on-month CPI for food increased by 0.5%, rising by 0.7 percentage points compared to the previous month, but significantly weaker than the seasonal norm (1.3%). With a higher base, the year-on-year rate was -4.3%, with the decline expanding by 2.7 percentage points from the previous month, increasing the drag on the year-on-year CPI by approximately 0.51 percentage points. Among these, pork prices showed weak fluctuations, shifting from a month-on-month increase of 0.9% to a decrease of 0.5%, continuing to be significantly weaker than the seasonal norm (3.8%). Non-food prices were down 0.1% month-on-month, a decrease of 0.6 percentage points compared to the previous month, roughly in line with the seasonal norm (-0.08%). Among the eight sub-categories, clothing, household goods and services, transportation and communication, and healthcare were stronger than seasonal, while other sub-categories were weaker than seasonal. The policy to expand domestic demand and promote consumption has continued to show effects, with the year-on-year price of industrial consumer goods excluding energy rising by 1.5%, an increase of 0.3 percentage points from the previous month. Among them, the year-on-year price increases for household appliances and recreational durable consumer goods expanded to 4.6% and 2.4%, respectively, collectively contributing approximately 0.09 percentage points to the year-on-year CPI increase. The price increases for core goods such as household appliances and vehicles continued to be stronger than seasonal.
In August, the national Producer Price Index (PPI) for industrial products decreased by 2.9% year-on-year, an increase of 0.7 percentage points from the previous month. The price of means of production decreased by 3.2% year-on-year, rising by 1.1 percentage points from the previous month. The price of consumer goods decreased by 1.7% year-on-year, a decline of 0.1 percentage points from the previous month. In August, the carryover effect and new price increase factors in the PPI affected the index by -0.7 percentage points and -2.2 percentage points respectively, with the carryover effect rising by 0.7 percentage points from the previous month, and the new price increase factors remaining unchanged. Therefore, the narrowing of the decline in the carryover effect is the reason for the year-on-year rebound in the PPI. (See the figure below)
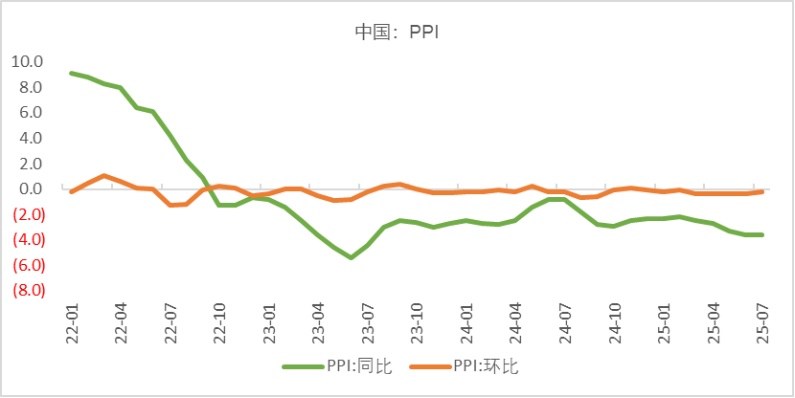
By industry, after the rebound from low levels, international oil prices entered an adjustment phase, with prices gradually being transmitted domestically, leading to marginal declines in domestic oil-related industry prices. The "anti-involution" policy continues to advance, causing the prices of upstream energy and raw materials such as coal, ferrous metals, and non-metallic minerals to warm up. Specifically, the growth rate of the coal mining and washing industry turned positive, rising by 4.3 percentage points from the previous month to 2.8%, ending a nine-month decline. The prices in the ferrous metal mining and dressing industry, as well as the ferrous metal smelting and rolling processing industry, shifted from a decrease to an increase, with month-on-month changes from a decline of 1.1% and 0.3% to increases of 2.1% and 1.9%, respectively. The decline in prices for the non-metallic mineral mining and dressing industry and the non-metallic mineral products industry narrowed, with month-on-month decreases of 0.5% and 1.0%, narrowing by 0.3 percentage points and 0.4 percentage points compared to the previous month. On the export side, the marginal easing of international trade conflicts, coupled with a slight increase in the global manufacturing climate compared to the previous month, reduced the downward pressure on prices in industries with a high export share. Influenced by the transmission of fluctuations in international non-ferrous metal prices, the domestic non-ferrous metal sector continued to be strong, with the upstream non-ferrous metal mining and dressing industry rising for 18 consecutive months on a month-on-month basis. Overall, the Producer Price Index (PPI) stabilized month-on-month, and the year-on-year decline narrowed, mainly due to multiple factors such as optimization of market competition order and lower base effects.
After the peak season ends, oil prices are more likely to fall than rise.
This month's crude oil prices have remained range-bound, mainly influenced by the following factors. From the supply side, OPEC+ decided to further increase production by 547,000 barrels per day in September, completing its plan to restore 2.2 million barrels per day ahead of schedule. This marks a strategic shift from "price stabilization" to "market share," leading to heightened expectations of oversupply in the global crude oil market. However, geopolitical factors also pose risks of crude oil supply disruptions from time to time, making it difficult for oil prices to decline smoothly, often resulting in impulsive rebounds.
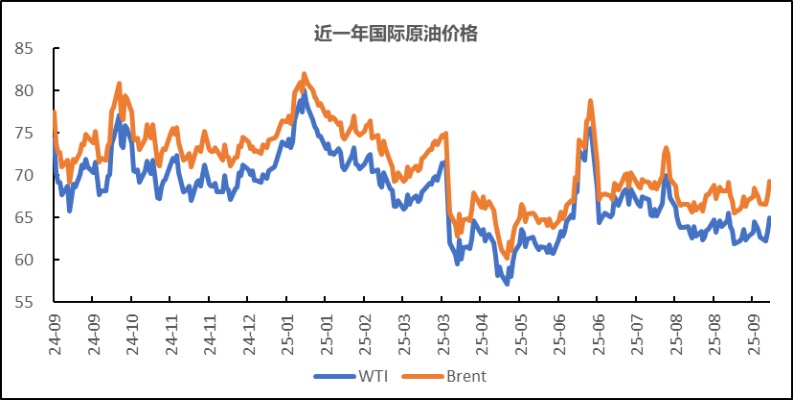
As of September 24, 2025, the Brent oil price was $69.31 per barrel, up 0.74% compared to the same period last month; while the WTI crude oil price was $64.99 per barrel, up 0.29% compared to the same period last month.
Graph: Crude Oil Price Trend
【Copyright and Disclaimer】This article is the property of PlastMatch. For business cooperation, media interviews, article reprints, or suggestions, please call the PlastMatch customer service hotline at +86-18030158354 or via email at service@zhuansushijie.com. The information and data provided by PlastMatch are for reference only and do not constitute direct advice for client decision-making. Any decisions made by clients based on such information and data, and all resulting direct or indirect losses and legal consequences, shall be borne by the clients themselves and are unrelated to PlastMatch. Unauthorized reprinting is strictly prohibited.
Most Popular
-

[January 2026 - Monthly Report on Macro and Crude Oil Market]
-

[BOPET Monthly Report] BOPET Market Experiences Volatile Increase in December, Expected to Continue Strengthening
-

[BOPP Monthly Report] BOPP: Downstream Demand in Seasonal Off-Season, January Market Shows Weak Shock Pattern
-

ABS: December ABS Market Falls Before Rising, Stalemate Expected in Future
-

[Zhuanshu Monthly Report] PE: Cost Collapse + Supply-Demand Imbalance, December PE Market Falls Nearly 7%! Short-Term Trend Rebound Unlikely


