


Inventory Accumulation Costs Weaken, Polyethylene Prices Under Pressure to Decline
Introduction: After the National Day holiday, polyethylene inventory has accumulated, the trade tensions between China and the United States have resurfaced, and crude oil prices have fallen, weakening cost support. Under the influence of these two factors, polyethylene prices are under downward pressure. This week, the price range for linear film in the North China region is fluctuating between 6,870 and 7,050 yuan/ton.
Inventory transmission is slow, leading to stockpiling at manufacturing enterprises.
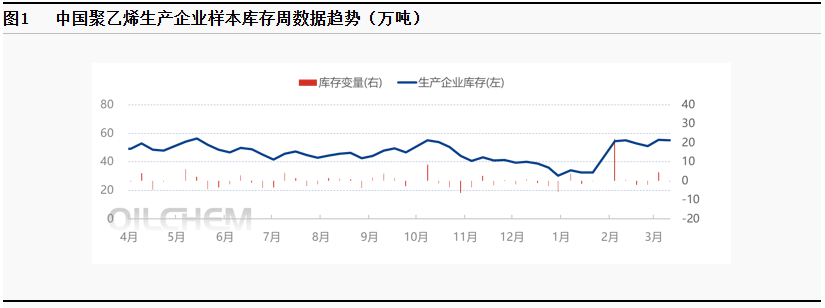
As of October 15, 2025, the sample inventory of polyethylene production enterprises in China is 529,500 tons, an increase of 40,900 tons compared to the previous period, up by 8.37% month-on-month. The inventory trend remains upward. Downstream factories have a weak mentality, continuing to show insufficient replenishment efforts, resulting in significant downward pressure on inventory, and the pace of inventory digestion has slowed, leading to a sustained accumulation trend in production enterprise inventories.
Oil prices are falling, weakening cost support.
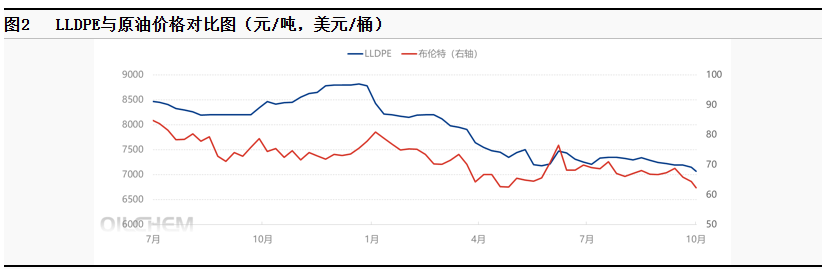
During this period (October 9 to October 15, 2025), international oil prices declined. As of October 15, the WTI price was $58.27 per barrel, down 5.27% from October 9, while the Brent price was $61.91 per barrel, down 5.08%. The main bearish factors included the International Energy Agency warning of long-term supply surplus risks, along with trade disputes initiated by the United States that suppressed demand prospects, both of which pressured the oil market. The recurrence of tariff discussions between China and the U.S. has led to significant fluctuations in the international crude oil market, resulting in a notable breakdown and decline in October, with both Brent and WTI crude futures hitting new lows not seen since early June this year. The drop in oil prices weakened cost support, leading to a decrease in polyethylene prices following the cost side.
Supported by the peak season, there are still expectations for an increase in terminal operations.
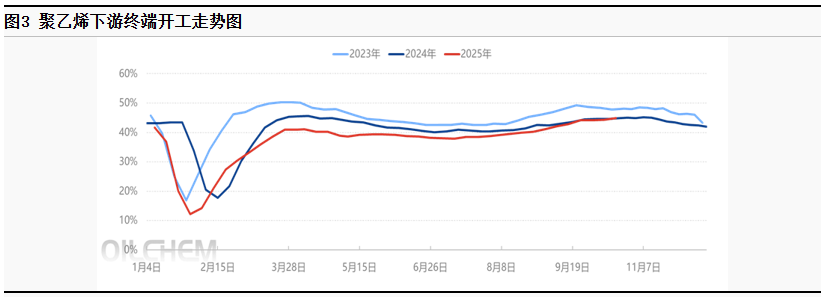
This week, the overall operating rate of downstream industries for polyethylene is 44.36%, an increase of 0.23% compared to last week, and is expected to rise by 0.56% next week.
The overall operating rate of agricultural films has increased by 7.3% compared to the previous period. The demand for greenhouse films has gradually entered the peak production season, with large-scale enterprises maintaining stable production and a steady increase in order expectations, indicating further potential for increased operations. The demand for plastic films is currently in the off-season, with the demand for garlic films in surrounding areas of North China entering the final stage. In the northwest and southwest regions, only a few enterprises are executing tender orders, while the majority of enterprises are either operating sporadically or are shut down.
PE The operating rate of sample enterprises for packaging film decreased by 0.7% month-on-month. Most product companies maintained stable operations, with limited new orders for packaging enterprises. Although short-term orders for e-commerce packaging and some composite films still support production, industrial packaging and other packaging consumption performed weakly, leading enterprises to primarily reduce their operating loads. Looking ahead to the next period, the average operating rate of sample enterprises for PE packaging film is expected to decrease by around 1%. The e-commerce stocking efforts have weakened, resulting in limited demand pull for packaging film, and the growth rate of orders for other packaging products is slowing down. Product companies are mainly executing short-term orders, with poor expectations for order continuity. Overall, there is still an expectation of improvement in terminal operations next week, but recent declines in raw material prices have led terminal factories to take a cautious wait-and-see approach, primarily engaging in essential procurement.
The driving force for pushing up is insufficient, and the price is weakly fluctuating.
Inventory accumulation combined with weakening cost factors has led to downward pressure on polyethylene prices. Looking ahead, on the supply side, the Fushun Petrochemical and Yulong Petrochemical units are set to start up, and Guangxi Petrochemical may be preparing for trial production, leading to an increase in domestic output. On the demand side, there is still room for improvement, but cautious purchasing continues to maintain just-in-time procurement. The supply and demand situation remains weak, with persistent supply pressure and insufficient momentum for price increases, resulting in weak price fluctuations. North China The market price fluctuation range for regional melting index 2 linear film is 6850-7050 yuan/ton.
【Copyright and Disclaimer】The above information is collected and organized by PlastMatch. The copyright belongs to the original author. This article is reprinted for the purpose of providing more information, and it does not imply that PlastMatch endorses the views expressed in the article or guarantees its accuracy. If there are any errors in the source attribution or if your legitimate rights have been infringed, please contact us, and we will promptly correct or remove the content. If other media, websites, or individuals use the aforementioned content, they must clearly indicate the original source and origin of the work and assume legal responsibility on their own.
Most Popular
-

AI Computing Power Demand Ignites Electronic Fabrics! China Jushi Hits Limit Up! Domestic Substitution Welcomes Golden Window
-

Focus on going global! kingfa sci. leads, huitong, preter, and kumho nire follow, china’s modified plastics frenziedly expanding worldwide
-

PA66 Cost and Profit: Broad-Based Weakness in the Feedstock Market Continues to Erode Cost Support for PA66 (202606)
-

Back-to-back major joker moves! covestro’s 1.32 million ton mdi dual-line expansion and hdi acquisition reshape global polyurethane landscape
-

Evonik Parts Ways With The Polyester Business! A Strategic Retreat By A Germany Chemical Giant And The Global Industry Shift


