


Industry Operation | A Brief Analysis of Automobile Production and Sales in July 2025
According to the analysis by the China Association of Automobile Manufacturers,7In the month, the car market entered the traditional off-season, with some manufacturers scheduling annual equipment maintenance, leading to a slowdown in production and sales pace. From the perspective of the industry market environment, the effects of the old-for-new policy continued to manifest, and positive progress was made in the industry's comprehensive restructuring efforts. Companies continued to launch new models, aiding in the stable operation of the car market. This month, automobile production and sales showed a seasonal decline month-on-month but achieved growth year-on-year, with new energy vehicles continuing their rapid growth trend.
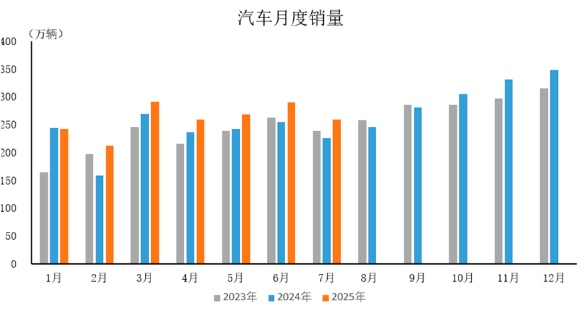
July 2025In September, automobile production and sales reached 2.591 million and 2.593 million units, respectively, representing a month-on-month decrease of 7.3% and 10.7%, and a year-on-year increase of 13.3% and 14.7%.。
From January to July 2025,Automobile production and sales reached 18.235 million and 18.269 million units respectively, representing year-on-year increases of 12.7% and 12%.。
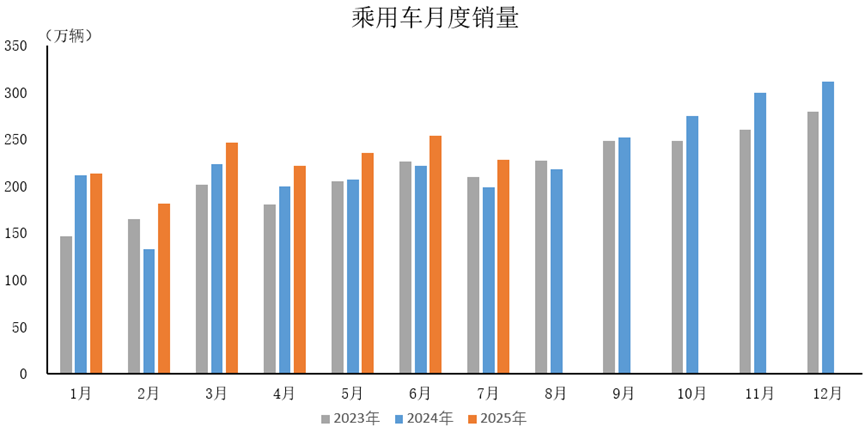
July 2025Passenger car production and sales reached 2.293 million and 2.287 million units respectively, representing a month-on-month decrease of 6% and 9.8%, and a year-on-year increase of 13% and 14.7%.。
January to July 2025,Passenger car production and sales reached 15.838 million and 15.841 million units respectively, with year-on-year increases of 13.8% and 13.4%.。
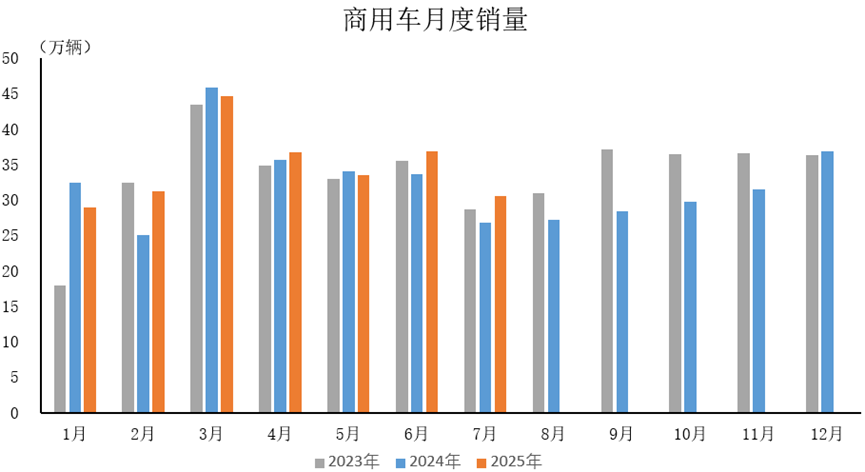
July 2025The production and sales of commercial vehicles reached 298,000 and 306,000 units respectively, representing a month-on-month decrease of 15.8% and 17.1%, and a year-on-year increase of 16.3% and 14.1% respectively.。
January to July 2025,The production and sales of commercial vehicles reached 2.397 million and 2.428 million units respectively, representing a year-on-year growth of 6% and 3.9%.。
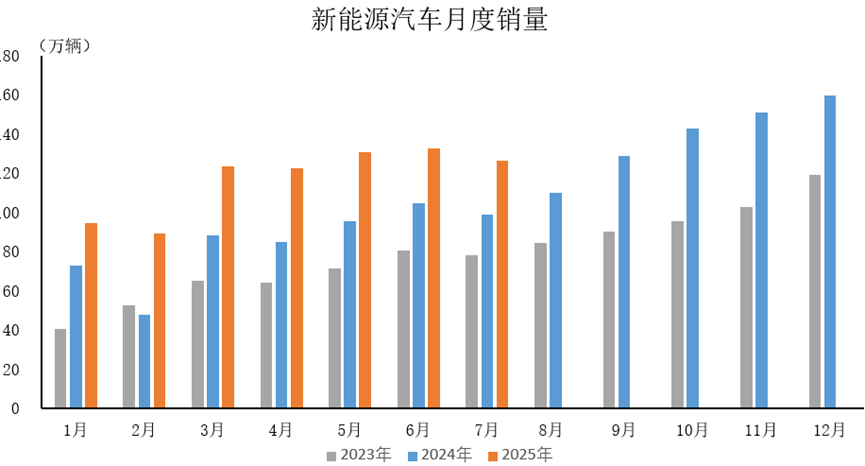
July 2025The production and sales of new energy vehicles reached 1.243 million and 1.262 million units, respectively, representing year-on-year growth of 26.3% and 27.4%.。
January to July 2025The production and sales of new energy vehicles reached 8.232 million and 8.22 million units respectively, representing year-on-year growth of 39.2% and 38.5%.。
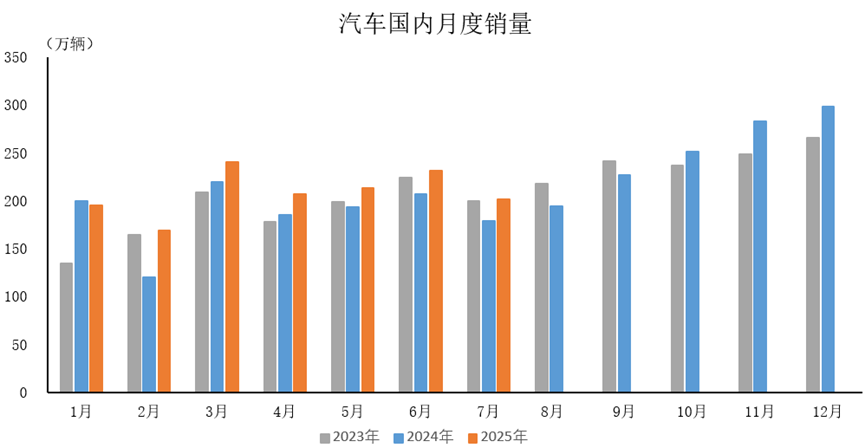
July 2025,Domestic car sales were 2.018 million units, down 12.7% month-on-month, and up 12.6% year-on-year.。
January to July 2025,Domestic automobile sales reached 14.588 million units, a year-on-year increase of 11.8%.。
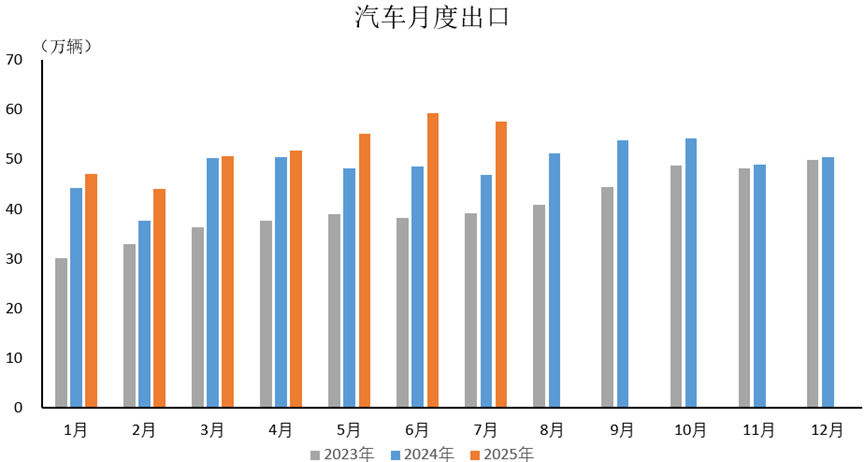
July 2025Car exports amounted to 575,000 units, a month-on-month decrease of 2.8% and a year-on-year increase of 22.6%.。
From January to July 2025,Car exports reached 3.68 million units, a year-on-year increase of 12.8%.。
This article is excerpted from the "China Automotive Industry Production and Sales Bulletin," Issue 8, 2025, with some content condensed. For more information, please contact us: Gao Lili at 13020028333, Liu Jianrong at 13521607432.
【Copyright and Disclaimer】The above information is collected and organized by PlastMatch. The copyright belongs to the original author. This article is reprinted for the purpose of providing more information, and it does not imply that PlastMatch endorses the views expressed in the article or guarantees its accuracy. If there are any errors in the source attribution or if your legitimate rights have been infringed, please contact us, and we will promptly correct or remove the content. If other media, websites, or individuals use the aforementioned content, they must clearly indicate the original source and origin of the work and assume legal responsibility on their own.
Most Popular
-

AI Computing Power Demand Ignites Electronic Fabrics! China Jushi Hits Limit Up! Domestic Substitution Welcomes Golden Window
-

Focus on going global! kingfa sci. leads, huitong, preter, and kumho nire follow, china’s modified plastics frenziedly expanding worldwide
-

Back-to-back major joker moves! covestro’s 1.32 million ton mdi dual-line expansion and hdi acquisition reshape global polyurethane landscape
-

Evonik Parts Ways With The Polyester Business! A Strategic Retreat By A Germany Chemical Giant And The Global Industry Shift
-

PA66 Cost and Profit: Broad-Based Weakness in the Feedstock Market Continues to Erode Cost Support for PA66 (202606)


