


In the past two months, China's telecommunications business revenue and total volume grew by 0.9% and 7.6% year-on-year, respectively.
In the past two months, the telecommunications business revenue has maintained positive growth. The construction and application of 5G and gigabit optical networks have been continuously advancing, steadily expanding the scale of user connections, and mobile internet access traffic has grown rapidly.
I. General Operation Status
Telecommunications business revenue saw a slight increase. In the first two months, the cumulative telecommunications business revenue reached 295 billion yuan, a year-on-year increase of 0.9%. Calculated at last year's constant price, the total telecommunications business volume grew by 7.6% year-on-year.
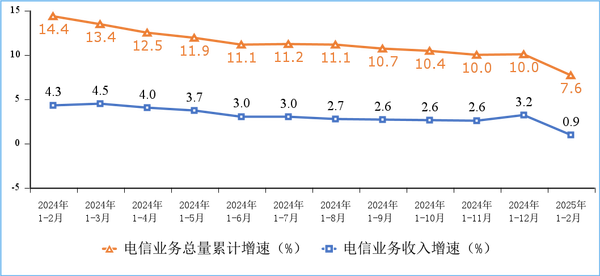
Figure 1: Cumulative Growth Rate of Telecommunications Business Revenue and Total Telecommunications Business Volume
II. Development of Telecommunication Users
The scale of gigabit users continues to expand. By the end of February, the total number of fixed broadband internet access users of the three basic telecommunications enterprises reached 675 million, an increase of 4.936 million compared to the end of last year. Among them, the number of fixed broadband internet access users with access speeds of 100 Mbps and above reached 641 million, accounting for 95% of the total user base; the number of fixed broadband internet access users with access speeds of 1000 Mbps and above reached 214 million, an increase of 67.41 million compared to the end of last year, accounting for 31.7% of the total user base, a 0.8 percentage point increase compared to the end of last year.
The number of 5G users is rapidly increasing. As of the end of February, the total number of mobile phone users of the three major telecommunications companies and China Broadcasting Network reached 1.793 billion, with a net increase of 3.273 million compared to the end of last year. Among them, the number of 5G mobile phone users reached 1.051 billion, with a net increase of 36.53 million compared to the end of last year, accounting for 58.6% of the total mobile phone users.
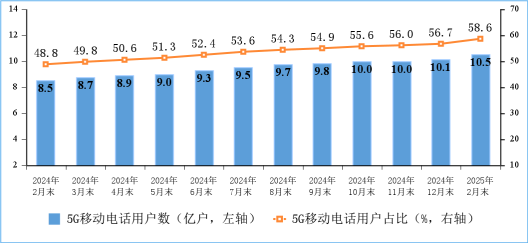
Figure 2 5G Mobile Phone Users状况
The number of users for cellular IoT is growing rapidly, while the user base for internet TV (IPTV, OTT) is steadily increasing. By the end of February, the three basic telecommunications enterprises had developed 2.702 billion cellular IoT terminal users, an increase of 46.08 million compared to the end of last year. The total number of internet TV (IPTV, OTT) users reached 409 million, an increase of 1.929 million compared to the end of last year.
III. Telecommunication Service Usage Situation
The growth rate of mobile internet traffic has slightly increased. In the first two months, the cumulative mobile internet traffic reached 55.39 billion GB, a year-on-year increase of 13.6%. As of the end of February, the number of mobile internet users reached 1.561 billion, a net decrease of 8.745 million compared to the end of the previous year. In February, the average mobile internet access traffic per user (DOU) reached 16.64 GB/user·month, a year-on-year increase of 11.3%, but 3.06 GB/user·month lower than the end of last year.
The volume of telephone calls has been declining continuously, while the volume of mobile text messages has surged significantly. In the first two months, the call duration for mobile phones reached 321.6 billion minutes, a year-on-year decrease of 5.9%; the call duration for fixed-line telephones reached 10.34 billion minutes, a year-ony decrease of 6.2%. In the first two months, the volume of mobile text messages nationwide increased by 18.3% year-on-year; the revenue from mobile text messaging services increased by 0.9% year-on-year.
IV. Communication Capability Status
The construction of gigabit fiber broadband networks continues to advance. As of the end of February, the number of internet broadband access ports nationwide reached 1.214 billion, an increase of 12.24 million compared to the end of the previous year. Among these, the number of fiber access (FTTH/O) ports reached 1.171 billion, an increase of 11.27 million compared to the end of the previous year, accounting for 96.5% of the internet broadband access ports. As of the end of February, the number of 10G PON ports capable of providing gigabit network services reached 28.92 million, an increase of 718,000 compared to the end of the previous year.
The construction of 5G networks is steadily advancing. By the end of February, the total number of 5G base stations reached 4.325 million, an increase of 74,000 compared to the end of the previous year, accounting for 34.1% of the total number of mobile base stations, an increase of 0.5 percentage points compared to the end of the previous year.
V. Regional Development Status
The penetration rates of 5G and gigabit users in various regions continue to rise. As of the end of February, the penetration rates of fixed broadband access users with speeds of 1000Mbps and above in the eastern, central, western, and northeastern regions were 32.1%, 31.8%, 32.5%, and 24.4%, respectively, an increase of 0.9, 0.6, 0.8, and 0.8 percentage points compared to the end of the previous year; the penetration rates of 5G mobile phone users were 58.4%, 59.2%, 58.4%, and 58.1%, respectively, an increase of 1.8, 2, 2.1, and 1.9 percentage points compared to the end of the previous year.
Mobile internet access traffic in the northeastern region grew at the fastest rate. In the first two months, mobile internet access traffic in the eastern, central, western, and northeastern regions reached 233.5 billion GB, 129.5 billion GB, 160 billion GB, and 30.9 billion GB, respectively, representing year-on-year growth of 12.7%, 14.1%, 13%, and 21.8%.
【Copyright and Disclaimer】The above information is collected and organized by PlastMatch. The copyright belongs to the original author. This article is reprinted for the purpose of providing more information, and it does not imply that PlastMatch endorses the views expressed in the article or guarantees its accuracy. If there are any errors in the source attribution or if your legitimate rights have been infringed, please contact us, and we will promptly correct or remove the content. If other media, websites, or individuals use the aforementioned content, they must clearly indicate the original source and origin of the work and assume legal responsibility on their own.
Most Popular
-

AI Computing Power Demand Ignites Electronic Fabrics! China Jushi Hits Limit Up! Domestic Substitution Welcomes Golden Window
-

Focus on going global! kingfa sci. leads, huitong, preter, and kumho nire follow, china’s modified plastics frenziedly expanding worldwide
-

Evonik Parts Ways With The Polyester Business! A Strategic Retreat By A Germany Chemical Giant And The Global Industry Shift
-

Back-to-back major joker moves! covestro’s 1.32 million ton mdi dual-line expansion and hdi acquisition reshape global polyurethane landscape
-

PA66 Cost and Profit: Broad-Based Weakness in the Feedstock Market Continues to Erode Cost Support for PA66 (202606)


