


In 2024, the performance of China's "Big Three" oil companies was revealed! CNPC and CNOOC saw resilient growth, while Sinopec faced pressure amid transformation!
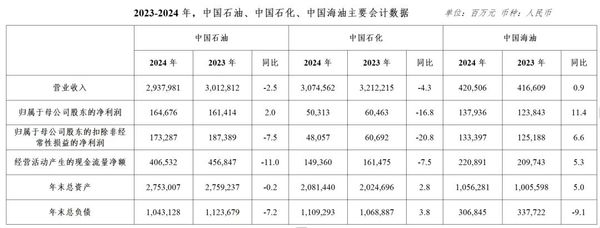
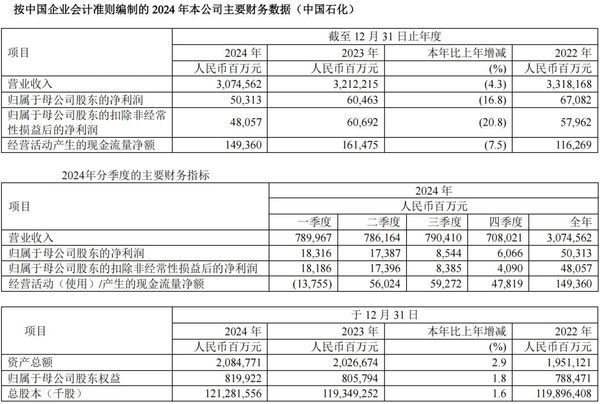
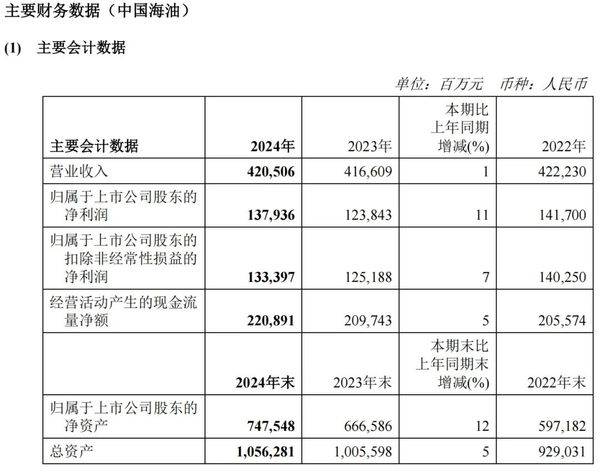
On March 30, with the release of China Petroleum's annual report, the 2024 performance of the "Big Three" oil companies has been fully disclosed. The reports show that China Petroleum achieved operating revenue of 2.94 trillion yuan, a year-on-year decrease of 2.5%; net profit attributable to shareholders was 164.68 billion yuan, a year-on-year increase of 2.0%. China Petrochemical achieved operating revenue of 3.07 trillion yuan, a year-on-year decrease of 4.3%; net profit attributable to shareholders was 50.313 billion yuan, a year-on-year decrease of 16.8%. China National Offshore Oil Corporation achieved operating revenue of 420.506 billion yuan, a year-on-year increase of 0.9%; net profit attributable to shareholders was 137.936 billion yuan, a year-on-year increase of 11.4%. In 2024, the combined net profit attributable to shareholders of the "Big Three" oil companies exceeded 352.925 billion yuan, equivalent to earning approximately 964 million yuan per day.
China National Petroleum: Net profit increases by 2.0% against the trend, setting a new historical high for three consecutive years.
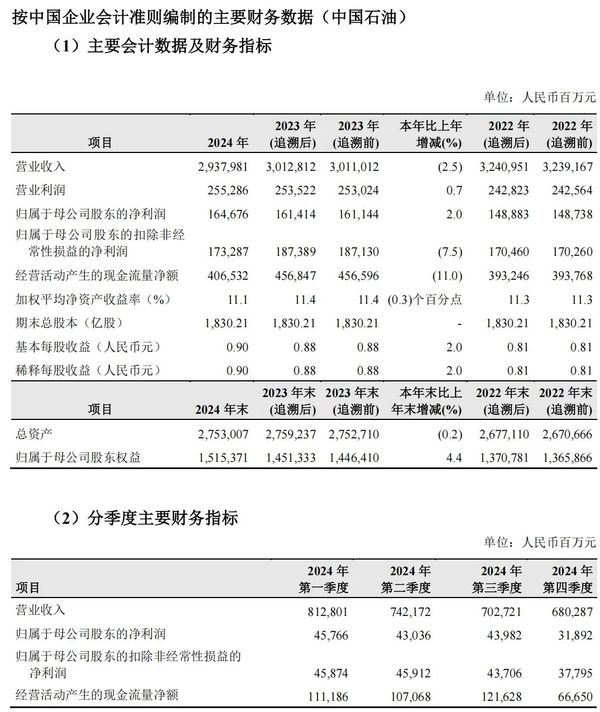
In 2024, China National Petroleum Corporation (CNPC) achieved operating revenue of 2.94 trillion yuan, a year-on-year decrease of 2.5%, primarily due to declines in the prices of crude oil, natural gas, refined oil products, and other oil and gas products, as well as reduced sales volumes of gasoline and diesel. Net profit attributable to shareholders reached 164.68 billion yuan, a year-on-year increase of 2.0%, marking a third consecutive year of record highs despite a 2.5% year-on-year drop in oil prices.
China National Petroleum Corporation (CNPC) maintains robust financial conditions, with net cash flow from operating activities reaching a substantial 406.55 billion yuan. To actively reward shareholders, CNPC's board of directors has proposed distributing a cash dividend of RMB 0.25 per share (including applicable taxes) for the year-end of 2024, based on the total share capital at the end of 2024, with a total dividend payout of approximately RMB 45.755 billion. The annual dividend per share stands at RMB 0.47, with a payout ratio of 52.2%, and the total annual dividend payout amounts to around RMB 86.02 billion. Both the year-end and annual dividends per share have reached their highest levels in history for the same period.
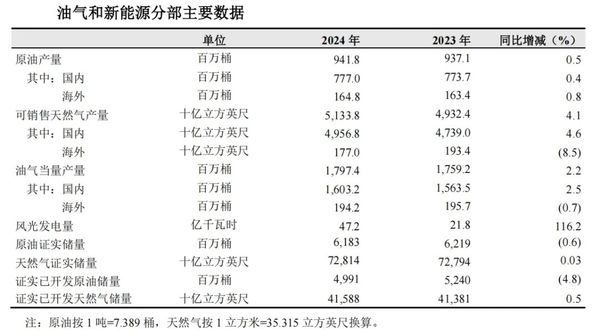
In terms of new energy business, China Petroleum is actively promoting a green and low-carbon transformation, relying on favorable conditions and concentrating advantageous resources to accelerate the development of its new energy business. In 2024, China Petroleum's wind and solar power generation reached 4.72 billion kilowatt-hours, a 116.2% increase from 2.18 billion kilowatt-hours in the same period last year; the newly added installed capacity for wind and solar power was 4.954 million kilowatts; new geothermal heating contracts signed covered an area of 75.12 million square meters. The first large-scale centralized wind power project in Jilin Oilfield and the first million-kilowatt-level photovoltaic power station in Golmud, Qinghai, were connected to the grid for power generation, while projects such as the Daqing Lindian wind and solar power generation and the 2.64 million-kilowatt new energy and integrated coal power carbon capture project in Karamay commenced construction. The carbon capture, utilization, and storage (CCUS) business across the entire industrial chain is accelerating its development.
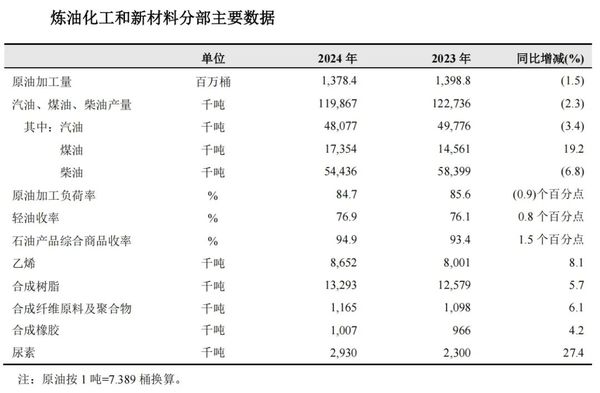
In the refining, petrochemicals, and new materials business sectors, China Petroleum is actively transitioning towards higher-end segments of the industrial chain. Key upgrading projects such as those at Jilin Petrochemical Company and Guangxi Petrochemical Company, including the ethylene project, are progressing steadily, and the Blue Sea New Materials project has been launched. In 2024, China Petroleum processed 1.378 billion barrels of crude oil, a decrease of 1.5% year-on-year; it produced 119,867,000 tons of refined oil products, a decrease of 2.3% year-on-year, with gasoline production down 3.4%, jet fuel up 19.2%, and diesel down 6.8%; the ethylene output was 8,652,000 tons, an increase of 8.1% year-on-year; and the synthetic resin output was 13,293,000 tons, an increase of 5.7% year-on-year.
Sinopec: Revenue and net profit both declined, with fluctuations in the gross profit of refining and chemical products weighing on overall performance.
In 2024, Sinopec achieved an operating income of 3.07 trillion yuan, a year-on-year decrease of 4.3%; the net profit attributable to shareholders was 50.313 billion yuan, a year-on-year decrease of 16.8%; the net profit attributable to shareholders after deducting non-recurring gains and losses was 48.06 billion yuan, a year-on-year decrease of 20.8%. Affected by the volatile decline in international crude oil prices, the accelerated replacement of traditional energy by new energy in the domestic transportation industry, and the continuous release of new production capacity in the chemical market, gross profit margins have significantly narrowed. The weak demand and narrowed profit margins for some refining and chemical products have collectively impacted Sinopec's profitability.
Despite the decline in revenue and profit, Sinopec maintained a high dividend payout ratio, with the total profit distribution ratio, including both dividends and repurchase amounts, reaching 75%. The company also established its first market value management system. The board of Sinopec proposed to distribute the final cash dividend of RMB 0.14 per share (tax included), and combined with the RMB 0.146 per share (tax included) distributed in the 2024 half-year period, the total cash dividend for 2024 would be RMB 0.286 per share (tax included).
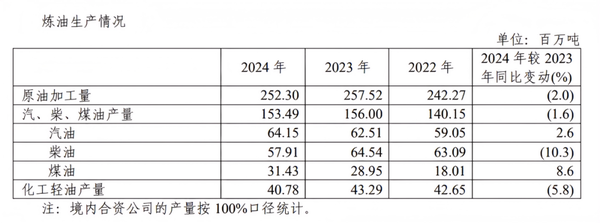
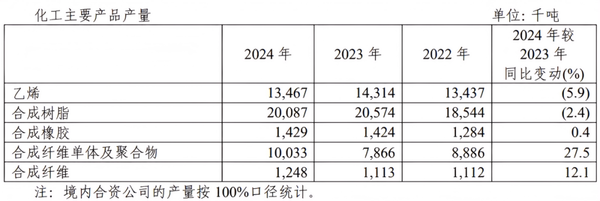
In the refining and chemical industry and new materials business, Sinopec's refining operations are guided by efficiency and aim to cope with market changes at low cost. In 2024, Sinopec processed a total of 252 million tons of crude oil throughout the year, producing 153 million tons of refined products, including a gasoline production increase of 2.6% year-on-year, a diesel production decrease of 10.3% year-on-year, and a coal oil production increase of 8.6% year-on-year. The total annual ethylene production was 13.467 million tons, a decrease of 5.9% year-on-year; the synthetic resin production was 20.087 million tons, a decrease of 2.4% year-on-year.
CNOOC: Cost Advantages Underpin High Profits Through Oil Price Cycles
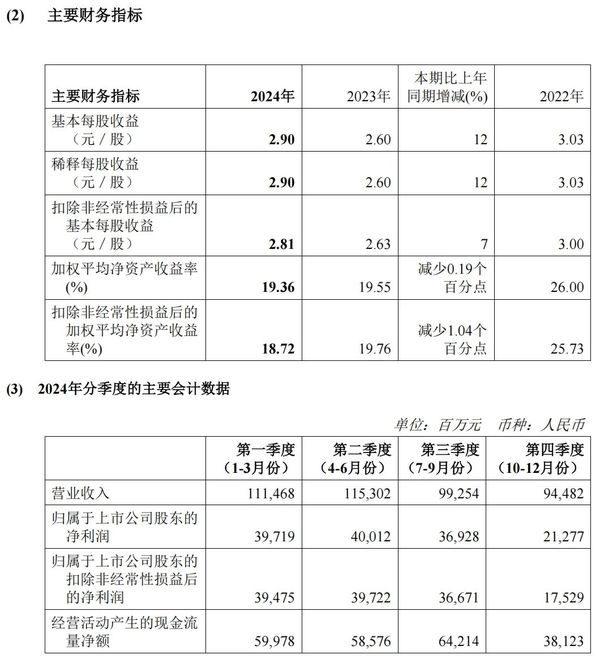
CNOOC maintained high profitability by focusing on quality improvement, cost reduction, and efficiency enhancement, enabling it to navigate the oil price cycle. In 2024, CNOOC achieved operating revenue of 420.506 billion yuan, a year-on-year increase of 0.9%, and a net profit attributable to equity holders of 137.936 billion yuan, up 11.4% year-on-year. This marked the second-highest performance in the group's history, only surpassed by the 141.7 billion yuan net profit recorded in 2022.
In order to share the development achievements with shareholders, the Board of Directors of CNOOC has proposed to distribute a final dividend of HK$0.66 per share (tax inclusive) for 2024. Together with the interim dividend of HK$0.74 per share (tax inclusive) already distributed, the total dividends for 2024, including the final and interim dividends, amount to HK$1.40 per share (tax inclusive).
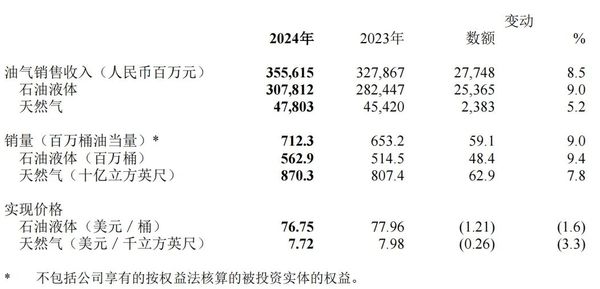
In terms of oil and gas production and sales, thanks to the contributions from oil and gas fields such as Bozhong 19-6 in China and the commissioning of overseas projects like Payara in Guyana, CNOOC achieved a net oil and gas production of 727 million barrels of oil equivalent in 2024, representing a year-on-year increase of 7.2%. Oil and gas sales volume reached 712 million barrels of oil equivalent, up 9.0% year-on-year, while oil and gas sales revenue amounted to 355.615 billion yuan, a year-on-year increase of 8.5%. The main cost per barrel of oil for the year was US$28.52 per barrel of oil equivalent, down approximately 1.1% year-on-year, further solidifying its competitive cost advantage.
Industry Outlook: Growing Pains and Opportunities Coexist
In 2024, the international oil price center will shift downward (Brent crude oil average price at $79.9 per barrel), coupled with the acceleration of domestic new energy substitution, putting pressure on the refining and sales sectors. The sales volume of gasoline and diesel by PetroChina and Sinopec declined year-on-year, while CNOOC achieved a breakthrough by relying on its upstream advantages. In 2025, the strategic focus of the "Big Three" oil companies will diverge: PetroChina will strengthen the synergy between natural gas and new energy, Sinopec will accelerate the high-end transformation of its refining and chemical business, and CNOOC will focus on deep-sea exploration and cost reduction and efficiency enhancement. In the future, cost control capabilities and industrial chain synergy efficiency will become the key for companies to navigate through the cycle.
【Copyright and Disclaimer】The above information is collected and organized by PlastMatch. The copyright belongs to the original author. This article is reprinted for the purpose of providing more information, and it does not imply that PlastMatch endorses the views expressed in the article or guarantees its accuracy. If there are any errors in the source attribution or if your legitimate rights have been infringed, please contact us, and we will promptly correct or remove the content. If other media, websites, or individuals use the aforementioned content, they must clearly indicate the original source and origin of the work and assume legal responsibility on their own.
Most Popular
-

AI Computing Power Demand Ignites Electronic Fabrics! China Jushi Hits Limit Up! Domestic Substitution Welcomes Golden Window
-

Focus on going global! kingfa sci. leads, huitong, preter, and kumho nire follow, china’s modified plastics frenziedly expanding worldwide
-

Back-to-back major joker moves! covestro’s 1.32 million ton mdi dual-line expansion and hdi acquisition reshape global polyurethane landscape
-

Evonik Parts Ways With The Polyester Business! A Strategic Retreat By A Germany Chemical Giant And The Global Industry Shift
-

PA66 Cost and Profit: Broad-Based Weakness in the Feedstock Market Continues to Erode Cost Support for PA66 (202606)


