


HDPE Output Surges, Select Plastic Stocks Edge Higher Today
1. August PE construction starts climbed, HDPE production surged 11.68% month-on-month.
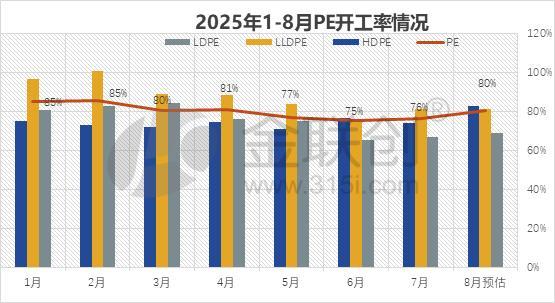
In August 2025, the overall operating rate of China's polyethylene (PE) industry is estimated at 80.44%, further increasing compared to July. By category, the operating rate for LDPE rose by 1.98 percentage points to 68.77%, mainly supported by the restart of Zhejiang Petrochemical’s facilities. The operating rate for LLDPE slightly increased by 0.04 percentage points to 81.16%, with stable plant operations. The operating rate for HDPE saw a significant increase of 8.65 percentage points to 82.65%, driven by the restart of Lianyungang Petrochemical, the commissioning of Jilin Petrochemical, and the shift of full-density units to low-pressure production, resulting in a substantial increase in HDPE supply.
1. LDPE production slightly increased, with differentiation existing among varieties.
In August, maintenance and restarts of LDPE units in China occurred simultaneously, with estimated output increasing by 2.96% month-on-month. Zhejiang Petrochemical's high-pressure unit was successfully restarted after completing maintenance in late July, effectively compensating for the capacity shortfall caused by the planned maintenance of Shenhua Xinjiang’s unit. Among specific product types, LDPE film grade saw the most significant increase, rising by 15,600 tons. In addition, heavy-duty packaging grade and cable grade also grew by 5,800 tons and 2,800 tons, respectively. Meanwhile, the output of coating grade and injection molding grade declined to varying degrees, with coating grade production decreasing by 13,000 tons and LDPE injection molding grade dropping by about 4,200 tons.
2. LLDPE supply stabilizes, with increased supply from Maoming Metal.
In August, the LLDPE market exhibited the characteristics of "overall stability with structural changes." Although total output increased only slightly by 0.04% month-on-month, there were significant adjustments among the different product types. During the month, the output of LLDPE film material (MI=2, without anti-blocking agent) increased by 56,800 tons, and the production of metallocene polyethylene also rose by 15,500 tons, reflecting an accelerating process of domestic substitution for high-end polyolefin imports. In contrast, LLDPE (MI=2, with anti-blocking agent) decreased by about 33,400 tons, other types of LLDPE (including medium-density film, ultra-low molecular weight polyethylene, C6 linear film, etc.) decreased by about 14,000 tons, LLDPE for injection molding fell by about 13,100 tons, and LLDPE (MI=1) declined by about 10,800 tons.
3. HDPE production surged significantly, driven notably by pipes and films.
In August, China's HDPE production increased by 11.68% month-on-month, marking the largest monthly increase of the year. This strong growth was mainly attributed to the dual-line restart of Lianyungang Petrochemical's facilities, the commissioning of new facilities at Jilin Petrochemical, and the adjustment of some full-density facilities to produce HDPE. However, Lianyungang Petrochemical has a planned shutdown during the month, and its subsequent operational status needs to be closely monitored. According to the early-month production schedule by enterprises for different product categories, the supply of HDPE film showed the most significant increase, with a month-on-month increment of approximately 103,700 tons. This is mainly due to Lianyungang Petrochemical's restart, during which this category was scheduled for production, while Luqing Petrochemical/Yulong Petrochemical also planned a phased increase in HDPE film production. Additionally, HDPE pipe production increased by approximately 68,100 tons, other HDPE products (including caps, rotational molding, ultra-high molecular weight, IBC barrels, medical dialysis fluid containers, fuel tanks, and fiber materials) increased by approximately 12,100 tons, HDPE injection molding increased by approximately 9,300 tons, HDPE wire drawing increased by approximately 2,200 tons, HDPE cable increased by approximately 1,100 tons, and HDPE large hollow products increased by approximately 800 tons. In contrast, the supply of small and medium-sized HDPE hollow products and CPE decreased month-on-month, with small and medium-sized HDPE hollow products decreasing by approximately 34,600 tons and CPE decreasing by approximately 21,900 tons.
In August, the domestic PE supply pattern is characterized by "increased HDPE output, stable LDPE, and flat LLDPE." It is expected that HDPE prices will be under pressure due to a loose supply environment, while LDPE prices will remain at a high level and consolidate.
2. Today's Plastic Prices
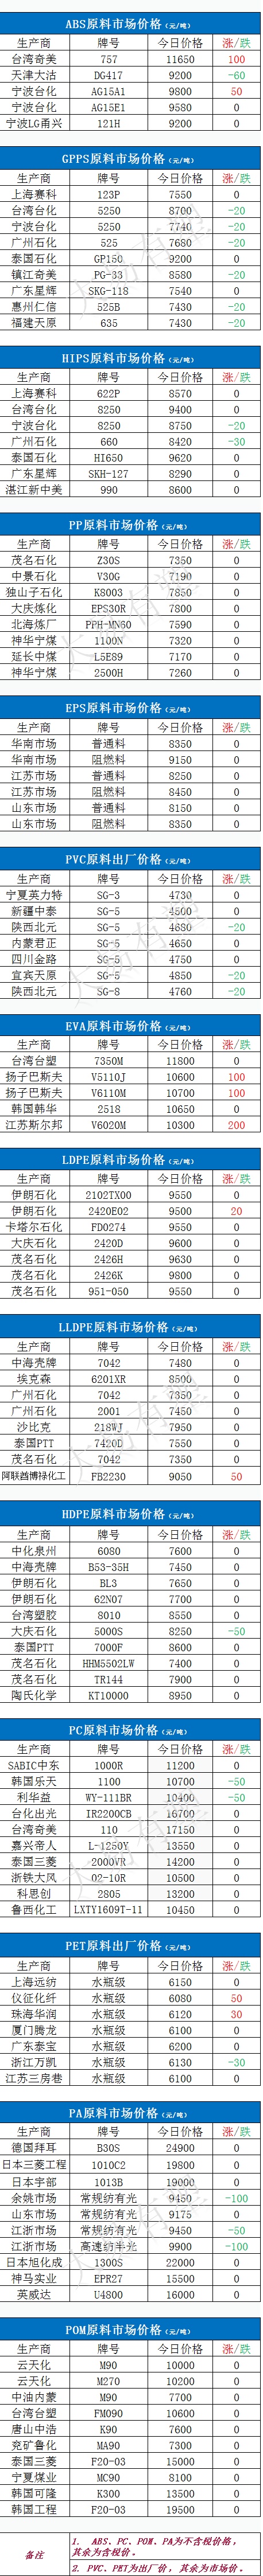
(Compiled from JLC and Dayi Yousu)
【Copyright and Disclaimer】The above information is collected and organized by PlastMatch. The copyright belongs to the original author. This article is reprinted for the purpose of providing more information, and it does not imply that PlastMatch endorses the views expressed in the article or guarantees its accuracy. If there are any errors in the source attribution or if your legitimate rights have been infringed, please contact us, and we will promptly correct or remove the content. If other media, websites, or individuals use the aforementioned content, they must clearly indicate the original source and origin of the work and assume legal responsibility on their own.
Most Popular
-

AI Computing Power Demand Ignites Electronic Fabrics! China Jushi Hits Limit Up! Domestic Substitution Welcomes Golden Window
-

Focus on going global! kingfa sci. leads, huitong, preter, and kumho nire follow, china’s modified plastics frenziedly expanding worldwide
-

Back-to-back major joker moves! covestro’s 1.32 million ton mdi dual-line expansion and hdi acquisition reshape global polyurethane landscape
-

Evonik Parts Ways With The Polyester Business! A Strategic Retreat By A Germany Chemical Giant And The Global Industry Shift
-

PA66 Cost and Profit: Broad-Based Weakness in the Feedstock Market Continues to Erode Cost Support for PA66 (202606)


