


Export orders hit a 10-month high vs. residents' leverage cooling off! PMI rebound hints at underlying crisis
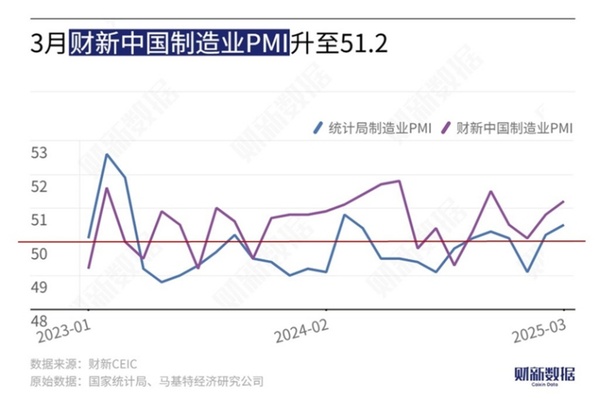
China's manufacturing PMI data for March continued to rise, with the Caixin China Manufacturing PMI reaching 51.2, a four-month high.National Bureau of Statistics manufacturingThe PMI also rose to 50.5, remaining in the expansion zone for two consecutive months. This positive signal indicates that, with the Spring Festival effect fading and macro policies taking effect, economic operations are steadily returning to an expansionary track. However, behind the data lie both the highlights of structural optimization and the hidden challenges of insufficient demand.
One,PMI data shows recovery: simultaneous expansion in total volume and divergence in structure
The positive March PMI data primarily stems from the coordinated improvement on both the supply and demand sides. The production index has risen to its highest level in nearly four months, and although the new orders index has slightly declined, it remains in the expansion zone, with strong performance in consumer goods new orders. The export orders index has reached its highest level since May 2024, reflecting a rebound in international market demand. From an industry structural perspective, the equipment manufacturing and high-tech manufacturing sectors have become the main driving forces, with their PMIs reaching 52% and 52.3%, significantly higher than the overall manufacturing level, indicating that new productivity is accelerating its growth.
II. Financial data reflects differentiated demand: enterprises leverage up while residents remain cautious.
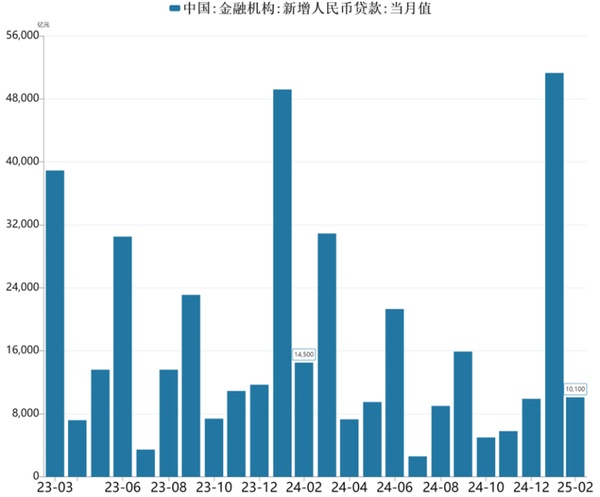
andThe contrast formed by the PMI warming is that in February, the financial data showed a differentiated characteristic of "strong enterprises, weak residents." Nationwide, in the first two months, RMB loans increased by 6.14 trillion yuan., where corporate and institutional loans account for nearly ninety percent, while household loans increased only by54.7 billion yuan, with a noticeable year-on-year decrease, particularly in the sluggish growth of medium and long-term loans (primarily mortgages). Therefore, although the manufacturing purchasing volume index rose to a four-month high, indicating an increased willingness for businesses to replenish inventories, the lack of motivation for households to "leverage up" has constrained the comprehensive recovery of domestic demand.
III. Marginal Improvement in Real Estate: Sales Recovery and Transformation Pain Interwoven
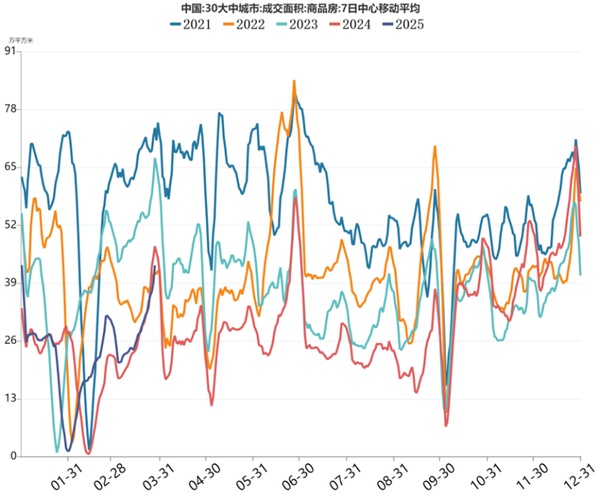
The real estate market shows positive signs in its adjustment.March saw an increase in commodity residential floor space sold环比上升。 (Note: The phrase "环比上升" typically means "rose compared with the previous month" or "saw a month-on-month increase" in English. However, since the original sentence already starts with "3月" which means March, I've adjusted the translation slightly for better fluency in English.)In first-tier cities, housing prices are showing initial signs of stabilization, and the premium rate in the land market has increased. Qiu Xiaohua, former director of the National Bureau of Statistics, pointed out that the deep adjustment in the real estate market has entered its final stage, with a narrowing decline in sales and investment, and inventory pressure is gradually easing in core cities. However, the current sales area remains at a historically low level for the same period.In the first two months, the sales area of newly built commercial properties across the country decreased by 5.1% year-on-year, and the problem of high inventory in third- and fourth-tier cities has not been fundamentally resolved.
Conclusion
The PMI rebound in March reflects the resilience of the economy, with expansions in areas like equipment manufacturing confirming the effectiveness of the transformation. However, structural issues in financial data and real estate serve as warnings that the rebound is not yet a comprehensive recovery. The foundation for the current economic upturn still needs to be consolidated: on one hand, the external environment remains complex and challenging, with global trade barriers potentially stifling export growth; on the other hand, insufficient domestic effective demand persists, leading to deflationary pressures, and corporate confidence has slightly declined.
Author: Zhou Yongle,Specialized Plastic World Market Research Expert

【Copyright and Disclaimer】This article is the property of PlastMatch. For business cooperation, media interviews, article reprints, or suggestions, please call the PlastMatch customer service hotline at +86-18030158354 or via email at service@zhuansushijie.com. The information and data provided by PlastMatch are for reference only and do not constitute direct advice for client decision-making. Any decisions made by clients based on such information and data, and all resulting direct or indirect losses and legal consequences, shall be borne by the clients themselves and are unrelated to PlastMatch. Unauthorized reprinting is strictly prohibited.
Most Popular
-

AI Computing Power Demand Ignites Electronic Fabrics! China Jushi Hits Limit Up! Domestic Substitution Welcomes Golden Window
-

Focus on going global! kingfa sci. leads, huitong, preter, and kumho nire follow, china’s modified plastics frenziedly expanding worldwide
-

Back-to-back major joker moves! covestro’s 1.32 million ton mdi dual-line expansion and hdi acquisition reshape global polyurethane landscape
-

Evonik Parts Ways With The Polyester Business! A Strategic Retreat By A Germany Chemical Giant And The Global Industry Shift
-

PA66 Cost and Profit: Broad-Based Weakness in the Feedstock Market Continues to Erode Cost Support for PA66 (202606)


