


Export Data Exceeds Expectations, Confirming Confidence: Analyzing China's Strong Logic in Countering the U.S. from September's Foreign Trade Performance
In September 2025, China's export data exceeded expectations again. The year-on-year growth rate of exports in dollar terms jumped from 4.4% in August to 8.3%, far surpassing Bloomberg's consensus estimate of 6.6%. The trade surplus expanded to $90.5 billion, with net exports continuing to support economic growth. Behind this performance lies the complex backdrop of the escalating China-U.S. trade rivalry, which highlights the strong confidence of Chinese foreign trade in countering pressures. While exports to the U.S. remain low, robust growth in non-U.S. markets effectively compensates for this, coupled with the momentum of industrial upgrading, together building export resilience.
In the recent Sino-US economic and trade game, China's firm stance and precise countermeasures have been particularly striking, breaking the previous inertia of "reactive responses." In response to a series of actions by the United States, such as tariff upgrades since April, the inclusion of 140 Chinese semiconductor companies on the entity list in June, and the expansion of export controls with the "affiliated company rule" in September, China has taken equivalent and precise counteractions: On October 9, the Ministry of Commerce introduced a "0.1% value ratio" threshold in the rare earth sector for the first time, directly targeting the US's "long-arm jurisdiction" rules; starting October 10, it imposed a tiered port fee on ships with more than 25% US ownership, using differentiated charges to guide the global shipping industry to choose Chinese-made ships; meanwhile, it launched an investigation into Qualcomm and sanctioned 14 US military-industrial companies, forming a multi-field countermeasure matrix. This preemptive strategy of "using the other's methods in return" directly targets the soft spots of American industries, putting the Trump administration on the defensive. Its contradictory behavior of threatening to "terminate trade relations with China" while simultaneously calling for dialogue reveals a state of exasperation.
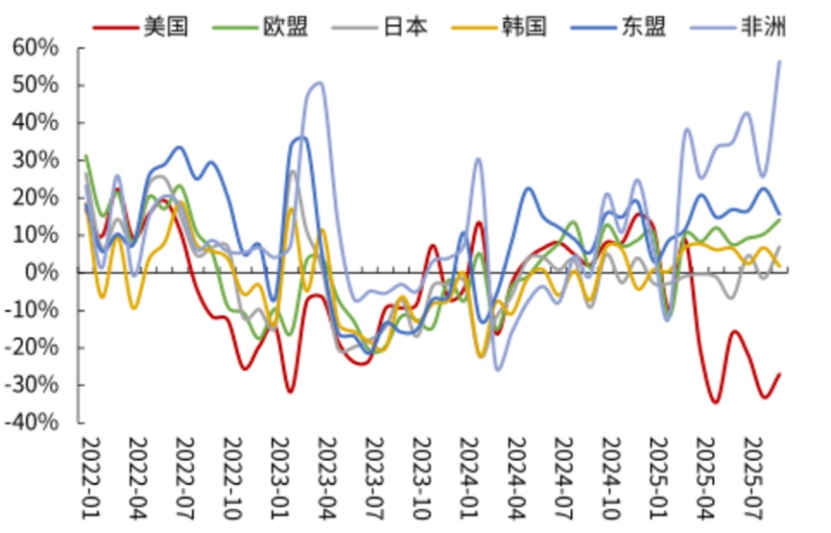
China's strong countermeasures are by no means impulsive or blind, as evidenced by the export data in September. From the perspective of country structure, the drag from trade with the U.S. has not shaken the overall export momentum: due to the impact of tariff escalation, China's exports to the U.S. in September still fell by 27% year-on-year, but exports to Africa, ASEAN, and the EU surged by 56.4%, 15.6%, and 14.2%, respectively. Together, these regions contributed over 7 percentage points, completely offsetting the negative impact of exports to the U.S. This substitution effect stems from the accelerated implementation of "Belt and Road" investments. From January to July, China's non-financial direct investment in Belt and Road participating countries increased by 24.7% year-on-year, driving a sharp increase in exports of related equipment and intermediate goods. Even if the U.S. attempts to curb Chinese industries through measures like shipping fees and chip embargoes, the global market has clearly voted with its feet: in August, China's shipyards received 84% of new orders in market share, and giants like Mediterranean Shipping Company have stated they are not affected by U.S. policies.
Graph: September Export Data Exceeds Expectations with Growth
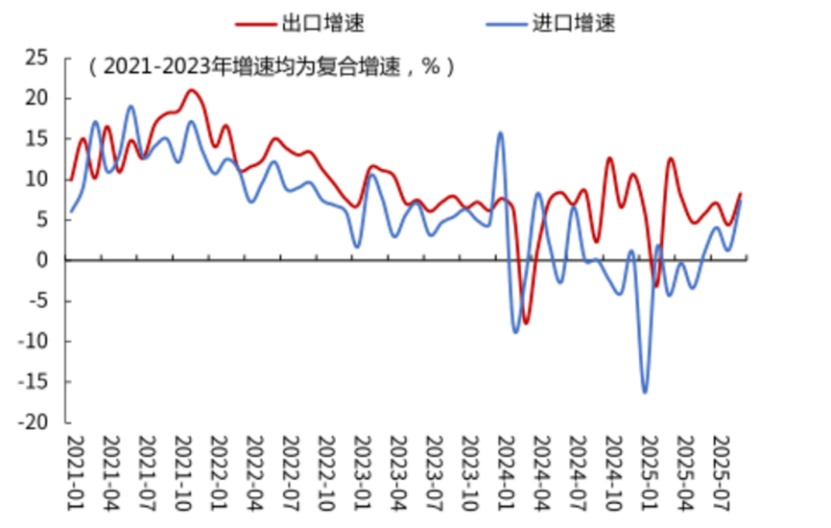
Figure: Year-on-year export growth rate of China to various countries or regions.
The optimization of the export product structure has further strengthened growth resilience. The growth rate of electromechanical products, the mainstay of exports, increased from 7.1% in August to 13.1%, contributing 7.7 percentage points to growth. Among these, the export of integrated circuits rose by 32.7% year-on-year, becoming a core growth driver under the influence of the AI industry. In the light industry and textile category, the growth rate of plastic exports rebounded from 0.8% to 3.8%, continuing to improve on the basis of 500.4 billion yuan in plastic products exports in the first eight months. This reflects a recovery in demand for basic materials due to the global manufacturing recovery. Meanwhile, the export prices of commodities like steel and rare earths have risen significantly, with rare earth export prices surging by 106% year-on-year, indicating an improvement in the "price for volume" pattern and an enhancement in the industry's bargaining power.
The short-term trajectory of China-U.S. trade relations remains uncertain, but the diversification of China's foreign trade has continued to show results. In the first three quarters, China's imports and exports with Belt and Road Initiative countries accounted for 51.7% of the total, and ASEAN has maintained its position as China's largest trading partner for five consecutive years. The export data from September demonstrates the resilience of China's foreign trade and the effectiveness of its structural optimization. Recently implemented countermeasures further prove that this resilience has been transformed into strategic confidence in the ongoing trade dynamics. In the short term, even with the pressure of a high base in the fourth quarter, exports are expected to maintain a high level of prosperity.
Author: Zhou Yongle, Senior Market Analysis Expert
【Copyright and Disclaimer】This article is the property of PlastMatch. For business cooperation, media interviews, article reprints, or suggestions, please call the PlastMatch customer service hotline at +86-18030158354 or via email at service@zhuansushijie.com. The information and data provided by PlastMatch are for reference only and do not constitute direct advice for client decision-making. Any decisions made by clients based on such information and data, and all resulting direct or indirect losses and legal consequences, shall be borne by the clients themselves and are unrelated to PlastMatch. Unauthorized reprinting is strictly prohibited.
Most Popular
-

AI Computing Power Demand Ignites Electronic Fabrics! China Jushi Hits Limit Up! Domestic Substitution Welcomes Golden Window
-

Focus on going global! kingfa sci. leads, huitong, preter, and kumho nire follow, china’s modified plastics frenziedly expanding worldwide
-

Back-to-back major joker moves! covestro’s 1.32 million ton mdi dual-line expansion and hdi acquisition reshape global polyurethane landscape
-

Evonik Parts Ways With The Polyester Business! A Strategic Retreat By A Germany Chemical Giant And The Global Industry Shift
-

PA66 Cost and Profit: Broad-Based Weakness in the Feedstock Market Continues to Erode Cost Support for PA66 (202606)


