


China's top 500 enterprises announced: "Three Oil Giants," Hengli, Rongsheng... Which Other Companies Made the List? Full List Included
September 15th
China Enterprise Confederation, China Enterprise Directors Association
"2025 China Top 500 Enterprises" list
▲Image source: China Industry News
This list is based on the 2024 corporate revenue.
As a selection criterion
Observe China's economic development.
An important window into the strength of an enterprise
What are the main characteristics of the rankings?
This year's list entry threshold has been raised again, reaching479.60 billion yuanCompared to the previous year, it increased by 579 million yuan.
The 2025 China Top 500 Enterprises' revenue reaches1,101.5 trillion yuanCompared to the previous year, it has increased.
The number of enterprises with a scale of 100 billion has increased to 267.Fifteen companies have an operating income exceeding one trillion yuan.The State Grid Corporation's revenue exceeded 3 trillion yuan and is about to surpass 4 trillion yuan.China National Petroleum Corporation, SinopecChina State Construction's operating revenue exceeds 2 trillion yuan.
In the list, there are 263 manufacturing companies, 169 service companies, and 68 companies in other industries.There are 39 new or re-entering companies.The above content is distributed inAutomobile and auto parts manufacturingInternet services and other industries.
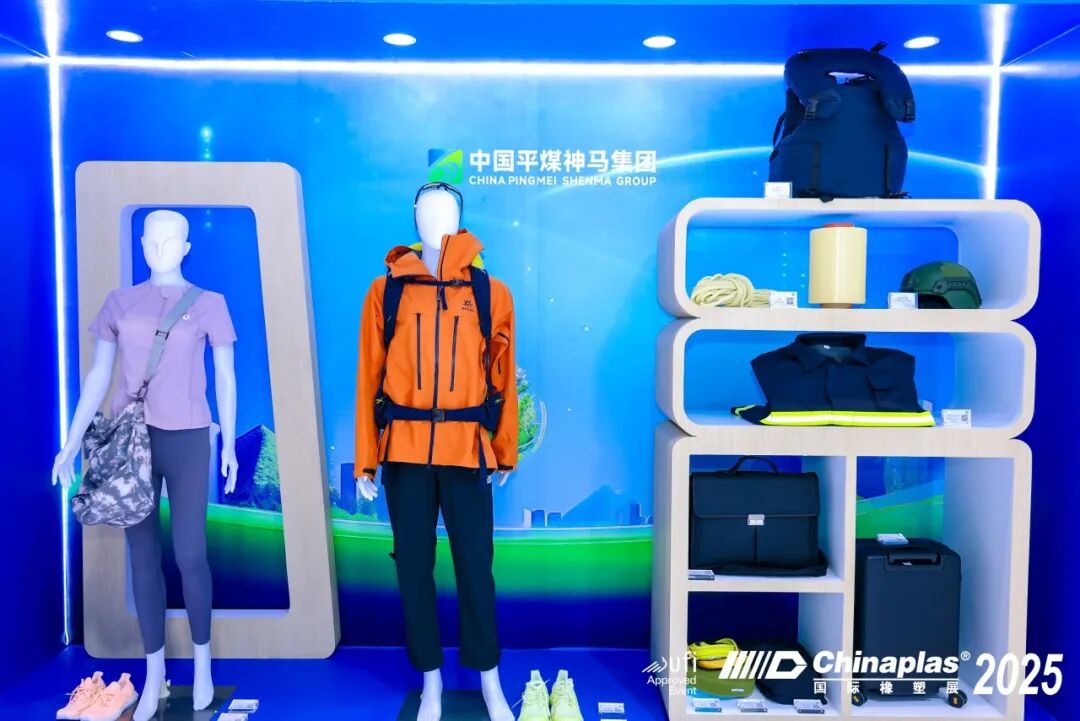
The list shows that companies related to the petrochemical industry, such as China National Petroleum Corporation (2, indicating the ranking, same below), China Petrochemical Corporation (3), China National Offshore Oil Corporation (18), Hengli Group (21), Rongsheng Group (32), Shenghong Group (40), Hengyi Group (54), Shaanxi Yanchang Petroleum (75), China National Chemical Engineering (134), Tongkun Holding (136), Wanhua Chemical (149), Pingmei Shenma Group (159), Shandong Dongming Petrochemical (173), Xinjiang Zhongtai (214), Shandong Jingbo (254), Yunnan Yuntianhua (304), Kingfa Sci & Tech (410), Huafon Group (413), and Dawn Group (500), made it to the list.
Specifically, see below 👇
1 Giants Lead and Diversified Layout
In this ranking list
Petrochemical companies rely on strong revenue and diversified structures.
Highlight the pillar status in the national economy.
Feature 1: Leading giants remain at the forefront.PetroChina and Sinopec ranked second and third on the list, with operating revenues reaching 29,690,481,300 yuan and 29,319,562,700 yuan, respectively.
Other petrochemical giants such as CNOOC, Hengli Group, and Rongsheng Group have also made it into the top 100, leading the industry's development with their massive scale and size.
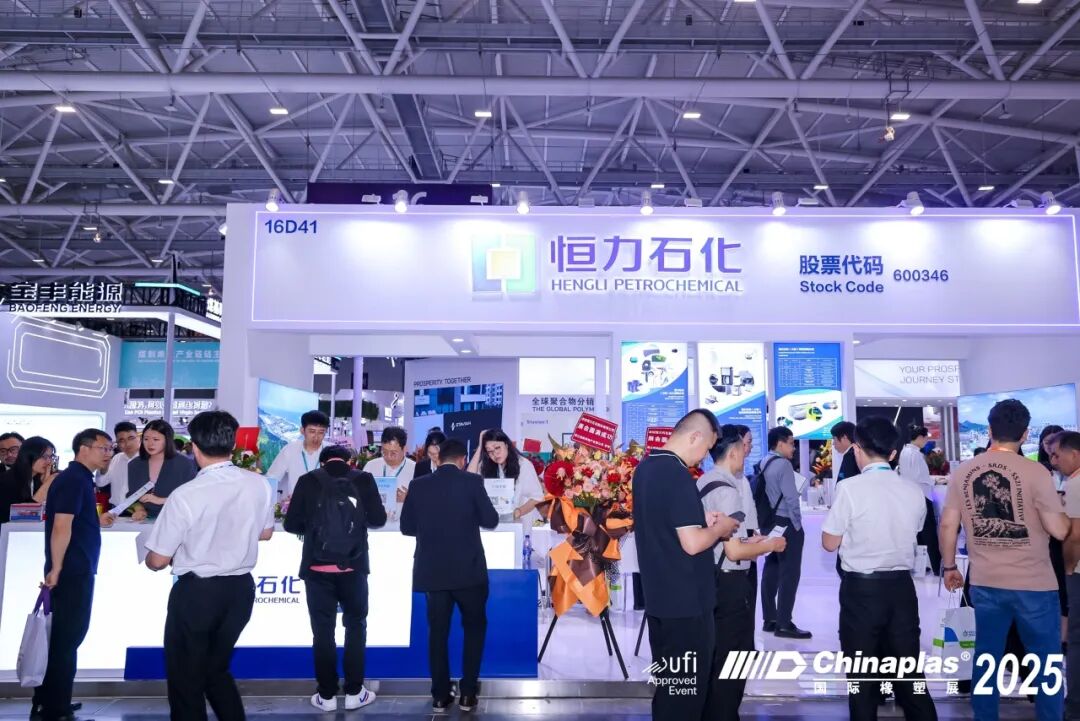
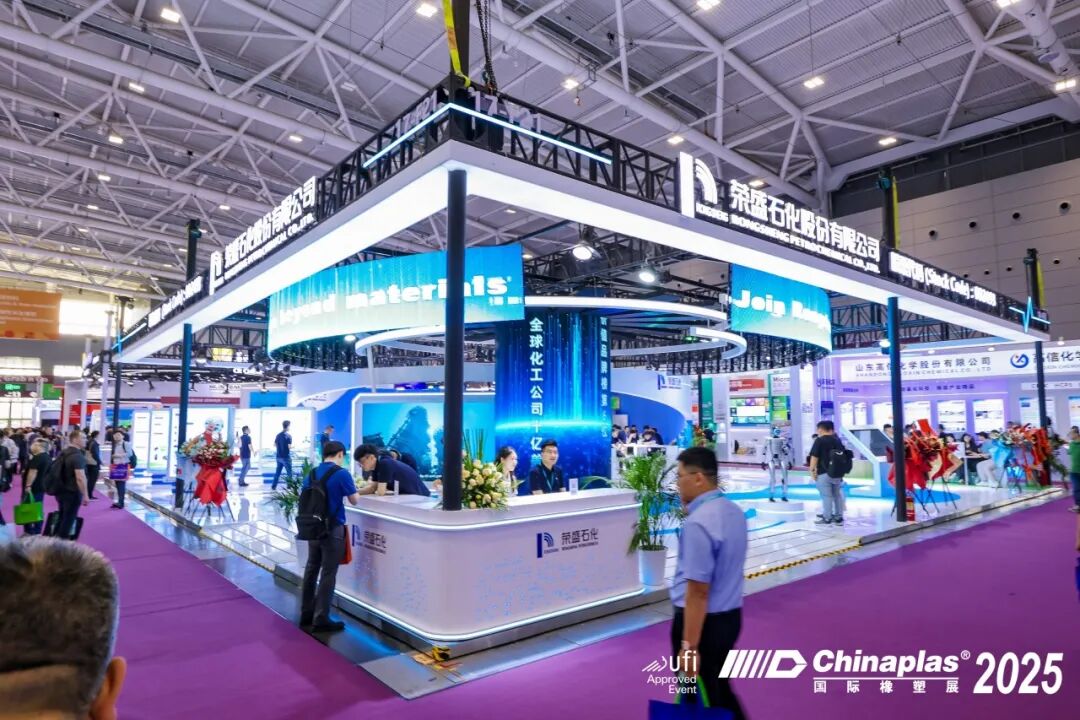
▲Photo taken at CHINAPLAS 2025 International Rubber & Plastics Exhibition
Feature 2: Diverse coverage of corporate lineup, with joint efforts from private and local enterprises.In addition to state-owned giants, outstanding private chemical companies such as Shenghong Group, Tongkun Holding, Wanhua Chemical, Shandong Dongming Petrochemical, and Shandong Jingbo, as well as local chemical enterprises like Shaanxi Yanchang Petroleum, Xinjiang Zhongtai, and Yuntianhua, have successfully made the list, forming a diversified development pattern of "state-owned leading, private supplementing, and local coordinating."
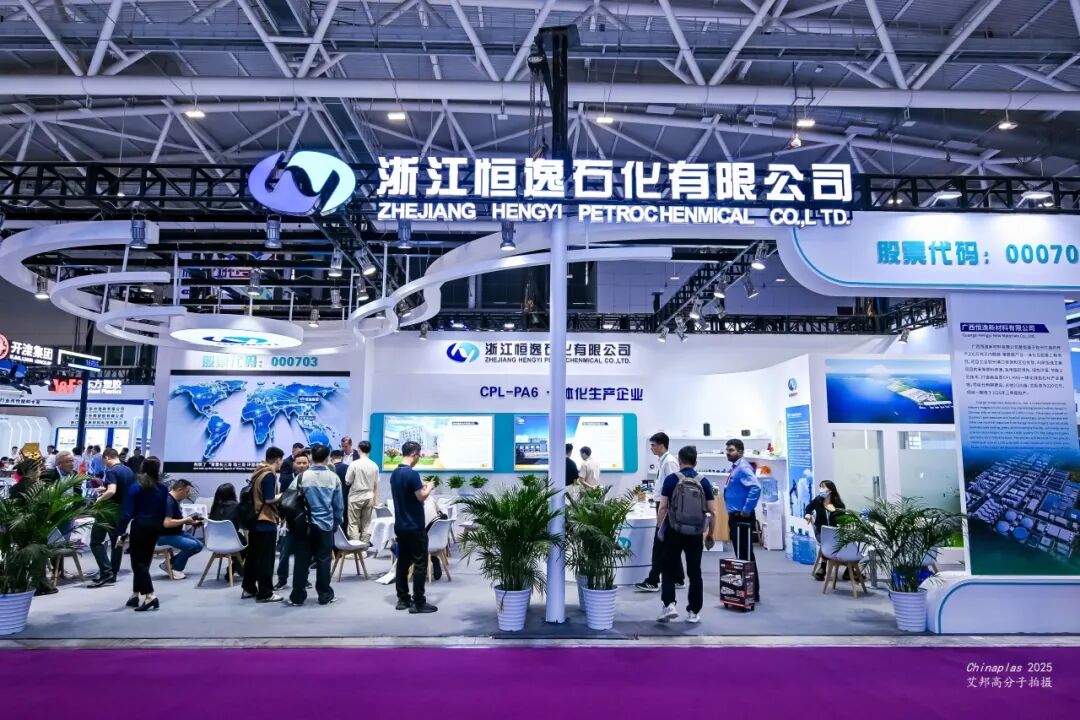
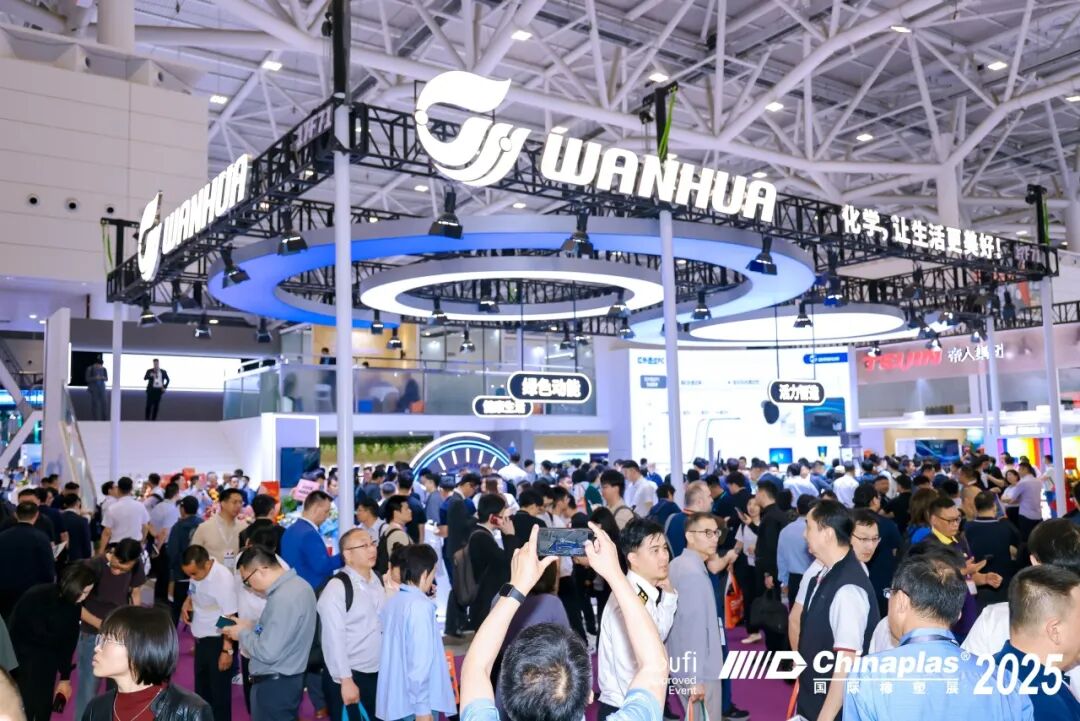
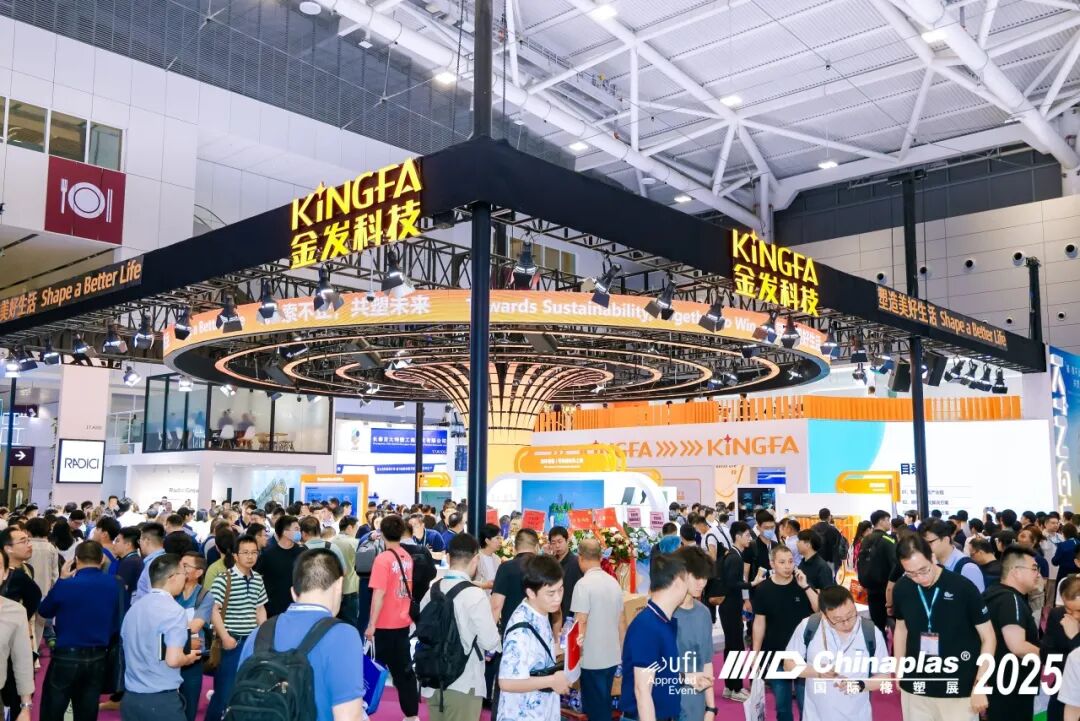
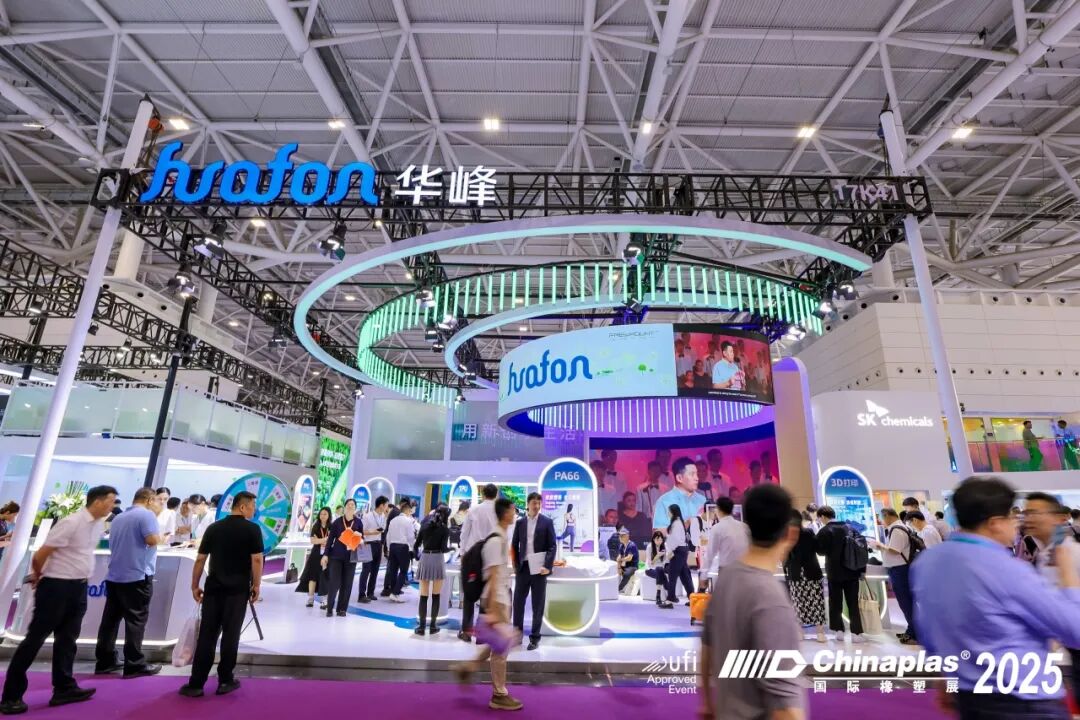
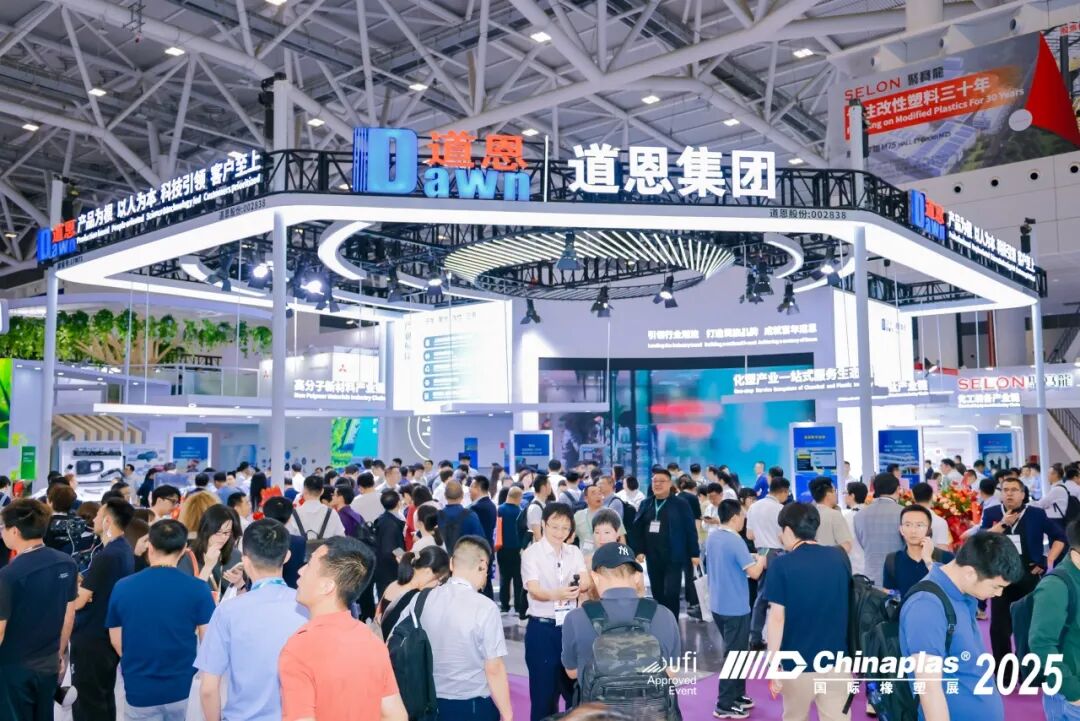
▲Photo taken at CHINAPLAS 2025 International Rubber & Plastics Exhibition
2 Innovation Intensification and Regional Concentration
Petrochemical companies not only have an advantage in scale, but also inInnovation investment Regional layoutIt shows strong development potential, injecting momentum into the transformation and upgrading of the industry.
From the perspective of innovation investment, enterprises are continuously increasing their research and development efforts. In 2025, China's Top 500 Enterprises...Invested a total of 1.73 trillion yuan in research and development expenses.The R&D intensity reached a new high of 1.95%, marking an increase for eight consecutive years.
From a regional distribution perspective, the industrial agglomeration effect is significant. The listed petrochemical companies are highly concentrated in the provinces with strong chemical industries.
Shandong ProvinceWith enterprises such as Shandong Dongming Petrochemical Group, Wanhua Chemical, and Shandong Jingbo Holdings Group, it has become an important hub.Zhejiang ProvinceZhejiang Rongsheng Holding Group, Zhejiang Hengyi Group, Tongkun Holding Group, and other companies have also been included in the list.Jiangsu, etc.Multiple enterprises from the province have also made the list, further highlighting the collaborative advantages of the regional industrial chain and providing support for the scaled development of the industry.
Today's sharing ends here.
Regarding this list
What do you think?
Welcome to chat in the comment section~

END
(Sources: CCTV News, People's Daily, China Enterprise Confederation, China National Petroleum and Chemical Corporation, China Industry News, China Chemical Industry Park, DT New Materials, etc., comprehensively compiled by CHINAPLAS International Rubber and Plastics Exhibition. Please cite when reproducing.)
【Copyright and Disclaimer】The above information is collected and organized by PlastMatch. The copyright belongs to the original author. This article is reprinted for the purpose of providing more information, and it does not imply that PlastMatch endorses the views expressed in the article or guarantees its accuracy. If there are any errors in the source attribution or if your legitimate rights have been infringed, please contact us, and we will promptly correct or remove the content. If other media, websites, or individuals use the aforementioned content, they must clearly indicate the original source and origin of the work and assume legal responsibility on their own.
Most Popular
-

AI Computing Power Demand Ignites Electronic Fabrics! China Jushi Hits Limit Up! Domestic Substitution Welcomes Golden Window
-

Focus on going global! kingfa sci. leads, huitong, preter, and kumho nire follow, china’s modified plastics frenziedly expanding worldwide
-

Back-to-back major joker moves! covestro’s 1.32 million ton mdi dual-line expansion and hdi acquisition reshape global polyurethane landscape
-

Evonik Parts Ways With The Polyester Business! A Strategic Retreat By A Germany Chemical Giant And The Global Industry Shift
-

PA66 Cost and Profit: Broad-Based Weakness in the Feedstock Market Continues to Erode Cost Support for PA66 (202606)


