


China's pp exports in first half of 2025 reshape global trade pattern; plastic market in weak turbulence, most decline by 10-100
In the first half of 2025, China's PP exports will reshape the global trade landscape.
Currently, China is still in the peak period of polypropylene capacity expansion. The supply is abundant and stable, and product quality is continuously improving, which significantly enhances export competitiveness. In the first half of this year, domestically...PPExports hit a new year-on-year high.The increase compared to the second half of last year.41.79 "10,000 tons, with a growth rate as high as"36.47%。2025In [specified year], China's polypropylene exports surpassed imports for three consecutive months, achieving a historic milestone.“Net export”。
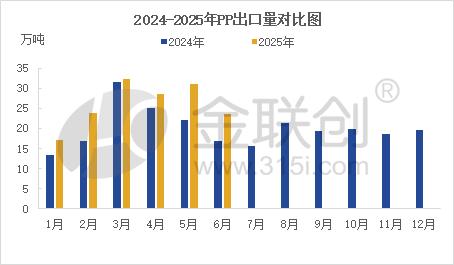
In the first half of 2025, export volume grew steadily overall.156.4010,000 tons, with a year-on-year increase of up to30.2910,000 tons, with an increase of24.02%。The average export value in the first quarter is24.41 Tons, the most exciting part is3In [this] month, China's export volume has once again reached a new high.32.22 Tens of thousands of tons, and surpassing imports by a significant margin.12.50%Net export volume reached3.59Achieving a historic breakthrough of ten thousand tons.
The main reason is,3In certain months, domestic resources have a price advantage, and with product inventory at high levels, companies actively offer discounts to boost export transactions and alleviate inventory pressure. On the other hand, in the United States...“ ”Policy uncertainty prompts traders to concentrate before the tariffs take effect.“Rush to export”Effectively promoted3The increase in monthly polypropylene exports.
The second quarter,4Due to tariff policies, the export costs of plastic products increased, leading to a decline in factory export orders and a reduced demand for the raw material polypropylene.PPExports have declined somewhat, but overall remain at a high level.5In recent months, China's polypropylene exports have continued to rise, with domestic overall supply being relatively sufficient, leading to weak market prices and the opening of export arbitrage opportunities. Additionally, in the middle of the month, the easing of tariff policies restored some orders for China's exports of polypropylene and plastic products to the United States, thereby promoting an increase in export volume.6In the months when the overseas consumer market gradually enters the traditional off-season, downstream orders do not follow up smoothly, resulting in a decline in export volume.6The increase in ocean freight prices in recent months has squeezed corporate export profit margins, leading to a reduction in some export orders.
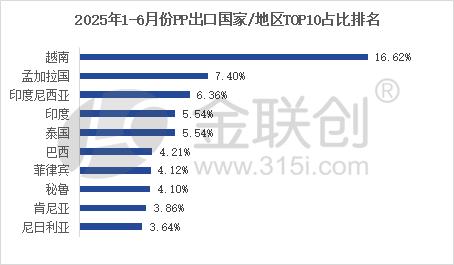
Main export destinations of polypropylene
Data source: JLC (Jinlianchuang)/Customs data
Southeast AsiaVietnam remains firmly in first place.1-6Exports to Vietnam in a monthPPTotal amount reached25.99million tons, accounting for the percentage of China's total exports.16.62%Secondly, Indonesia and Thailand, with the total export volume of both.18.60 10,000 tons.
Total exports of Bangladesh and India combined20.2410,000 tons, accounting for approximately12.94%。
In the first half of the year, Brazil's total exports amounted to6.59The overall export volume decreased compared to last year, reaching ten thousand tons.
At present,Southeast Asia possesses three key factors: "limited supply and high demand, proximity, and favorable policies," making it in China.PPIn the export landscape, it has occupied a significant share for a long time and is difficult to be replaced by South Asia or South America in the short term.Looking to the future,2025The second half of the year is expected in China.PPExports first decrease and then increase.On the one hand7-8During the months of high temperature and humidity, Southeast Asia experiences a low demand season. Additionally, with high sea freight costs, the profits of exporting companies and traders are squeezed, leading to a decline in some export orders.9-10The months of September and October are peak seasons, known as "Golden September and Silver October," during which overseas manufacturing companies moderately restock.PPThe export volume may reach the highest peak of the year.11-12As the month coincides with the year-end closure, companies actively reduce prices to lower inventory, and the export window continues to open, with overseas demand possibly securing orders at low prices. However, attention still needs to be paid to the impact of global trade policies on export volumes in the second half of the year.
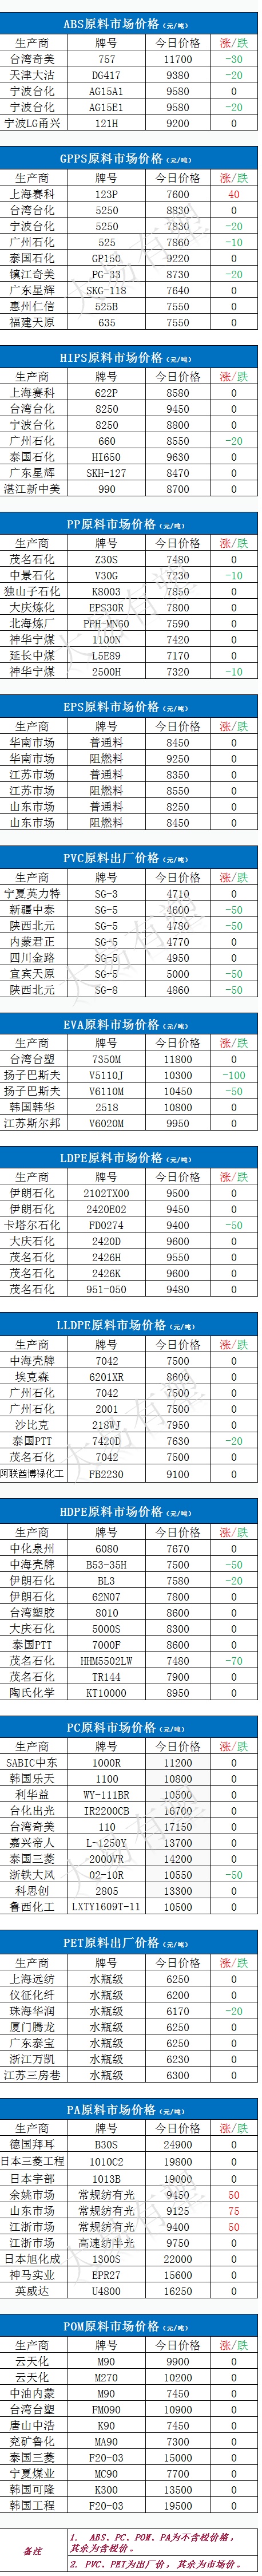
Today's plastic prices
(The above is compiled from JLC Network Technology and Dayi You Plastics)
【Copyright and Disclaimer】This article is the property of PlastMatch. For business cooperation, media interviews, article reprints, or suggestions, please call the PlastMatch customer service hotline at +86-18030158354 or via email at service@zhuansushijie.com. The information and data provided by PlastMatch are for reference only and do not constitute direct advice for client decision-making. Any decisions made by clients based on such information and data, and all resulting direct or indirect losses and legal consequences, shall be borne by the clients themselves and are unrelated to PlastMatch. Unauthorized reprinting is strictly prohibited.
Most Popular
-

AI Computing Power Demand Ignites Electronic Fabrics! China Jushi Hits Limit Up! Domestic Substitution Welcomes Golden Window
-

Focus on going global! kingfa sci. leads, huitong, preter, and kumho nire follow, china’s modified plastics frenziedly expanding worldwide
-

Back-to-back major joker moves! covestro’s 1.32 million ton mdi dual-line expansion and hdi acquisition reshape global polyurethane landscape
-

Evonik Parts Ways With The Polyester Business! A Strategic Retreat By A Germany Chemical Giant And The Global Industry Shift
-

PA66 Cost and Profit: Broad-Based Weakness in the Feedstock Market Continues to Erode Cost Support for PA66 (202606)


