


China's Industrial Output Up 5.2% Year-on-Year in August; Rubber and Plastics Industry Rises 3.5%, Plastic Market Remains Volatile
National Bureau of Statistics: In August, the value added of industries above designated size increased by 5.2% year-on-year in real terms.
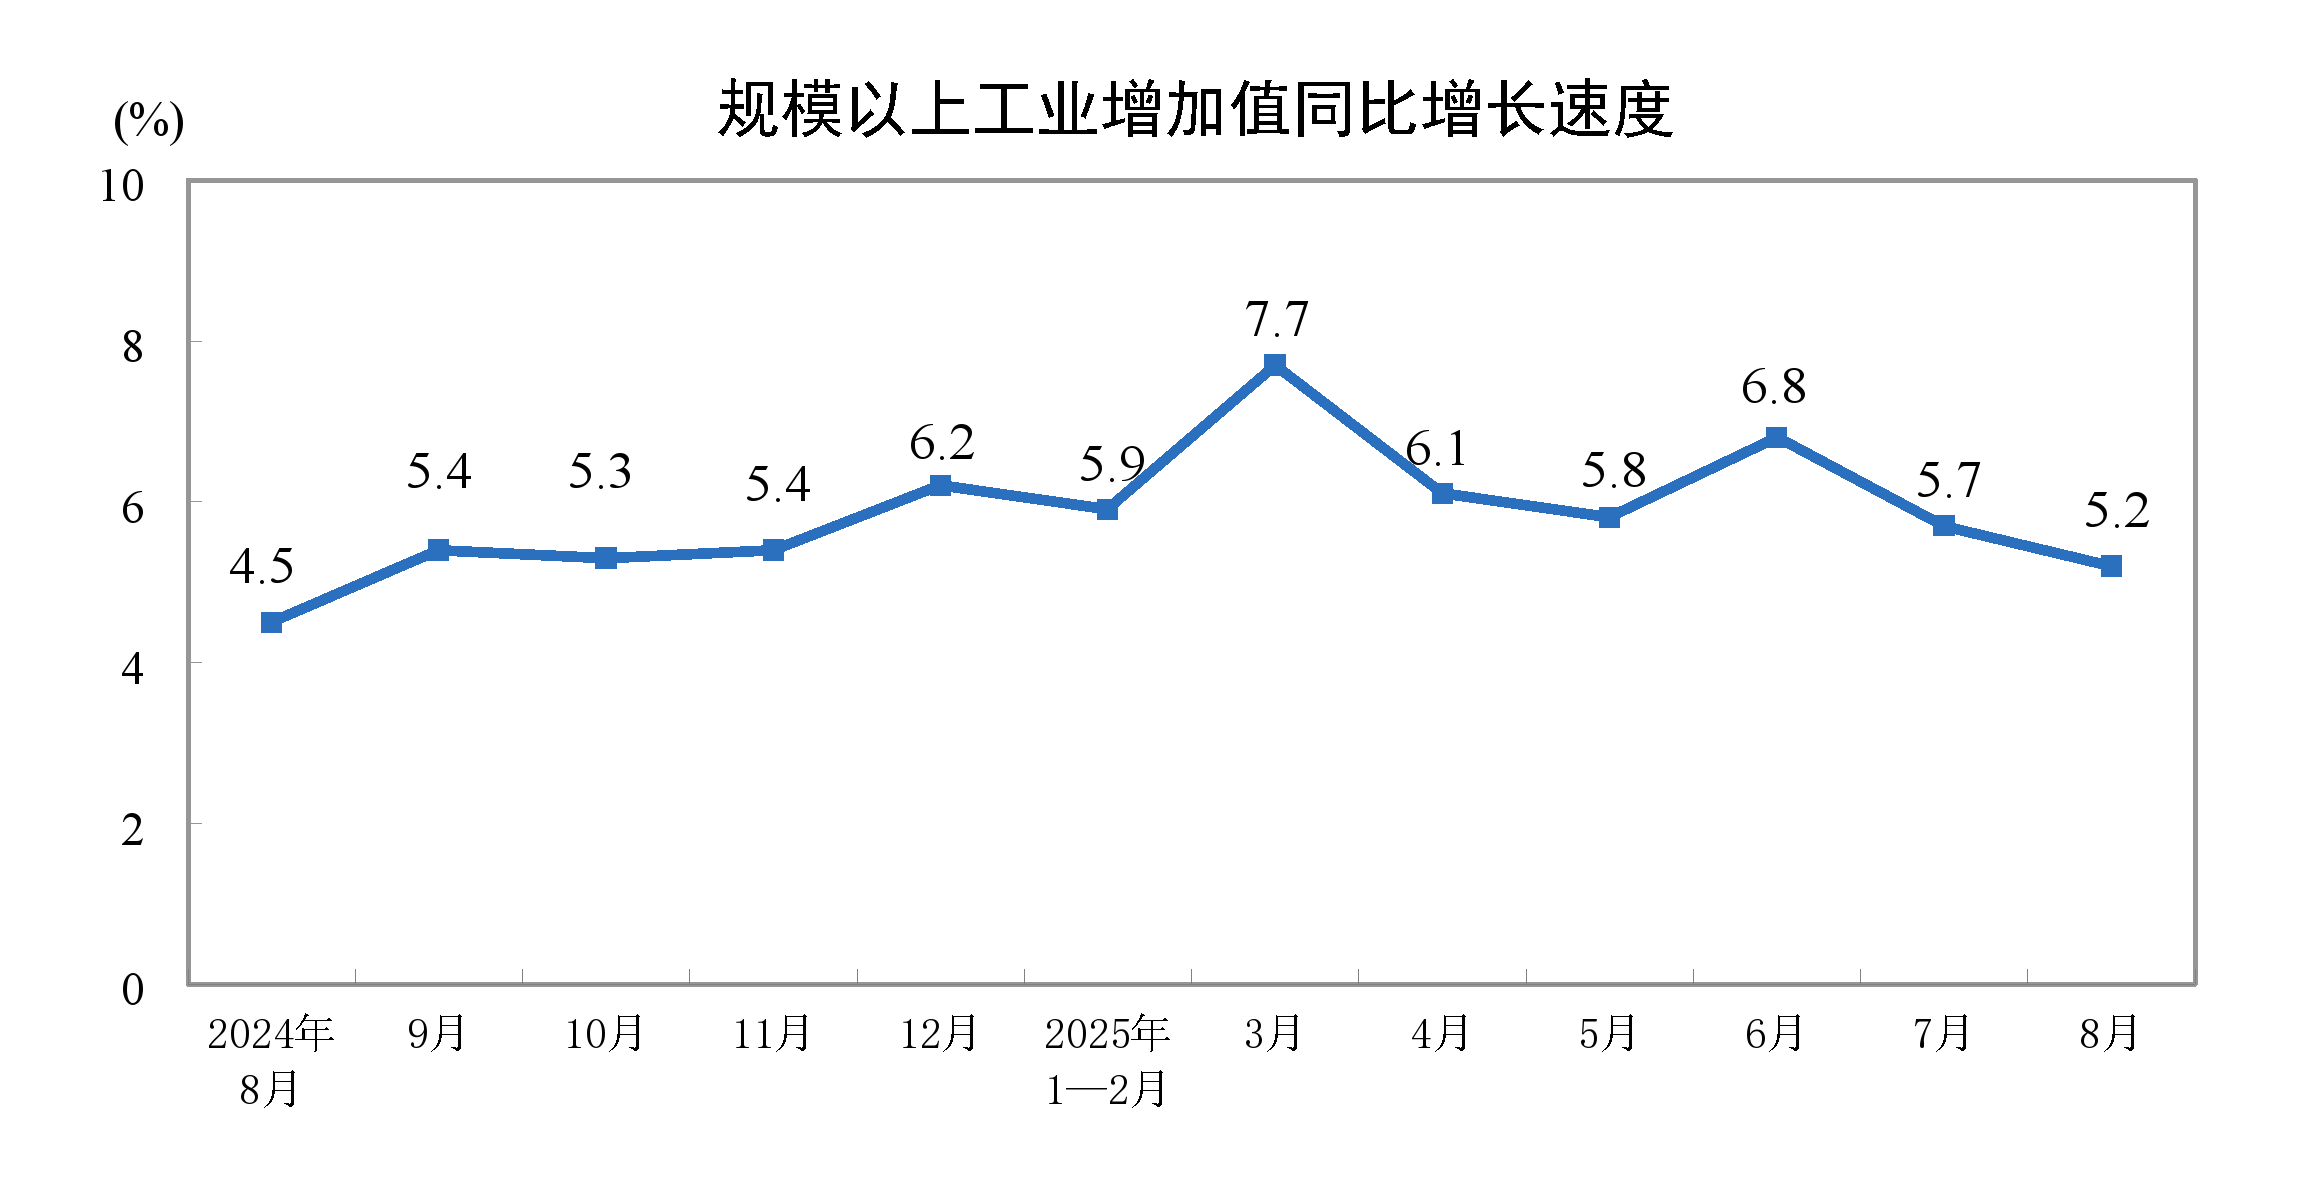
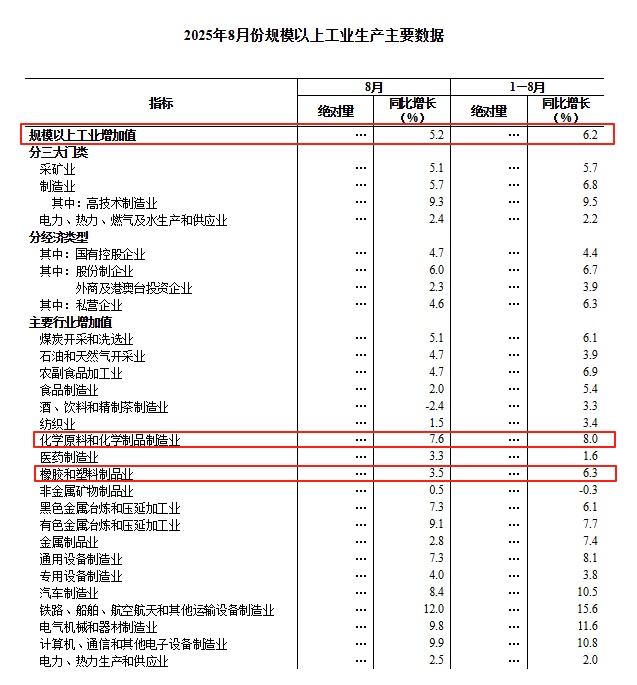
Cailian Press, September 15 — According to data from the National Bureau of Statistics,In August, the industrial added value of enterprises above designated size increased by 5.2% year-on-year in real terms. Month-on-month, the industrial added value increased by 0.37% compared to the previous month. From January to August, the industrial added value increased by 6.2% year-on-year. By industry, the rubber and plastic products industry saw a year-on-year increase of 3.5% in August and a 6.3% increase from January to August; the chemical raw materials and chemical products manufacturing industry experienced a year-on-year increase of 7.6% in August and an 8.0% increase from January to August.
In August 2025, the industrial added value of enterprises above designated size increased by 5.2%.
In August, the value added of industries above designated size increased by 5.2% year-on-year in real terms (all growth rates of value added are real growth rates after deducting price factors). On a month-on-month basis, the value added of industries above designated size grew by 0.37% in August. From January to August, the value added of industries above designated size increased by 6.2% year-on-year.
From the perspective of three major categories, in August, the value added of the mining industry increased by 5.1% year-on-year, the manufacturing industry grew by 5.7%, and the production and supply of electricity, heat, gas, and water increased by 2.4%.
In terms of economic types, in August, the added value of state-controlled enterprises increased by 4.7% year-on-year; joint-stock enterprises increased by 6.0%, foreign-funded enterprises and enterprises with investment from Hong Kong, Macao, and Taiwan increased by 2.3%; private enterprises increased by 4.6%.
By industry, in August, among the 41 major sectors, 31 sectors saw a year-on-year increase in value added. Specifically, the coal mining and washing industry grew by 5.1%, the oil and natural gas extraction industry grew by 4.7%, the agricultural and sideline food processing industry grew by 4.7%, the manufacture of alcoholic beverages, beverages, and refined tea declined by 2.4%, the textile industry grew by 1.5%, the manufacture of chemical raw materials and chemical products grew by 7.6%, the non-metallic mineral products industry grew by 0.5%, the ferrous metal smelting and rolling processing industry grew by 7.3%, the non-ferrous metal smelting and rolling processing industry grew by 9.1%, the general equipment manufacturing industry grew by 7.3%, the specialized equipment manufacturing industry grew by 4.0%, the automobile manufacturing industry grew by 8.4%, the railway, ship, aerospace, and other transportation equipment manufacturing industry grew by 12.0%, the electrical machinery and equipment manufacturing industry grew by 9.8%, the computer, communication and other electronic equipment manufacturing industry grew by 9.9%, and the power and heat production and supply industry grew by 2.5%.
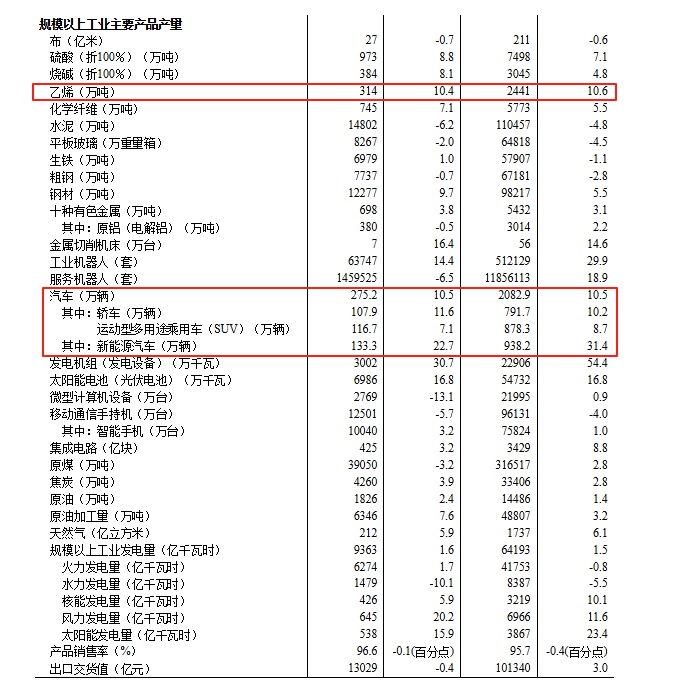
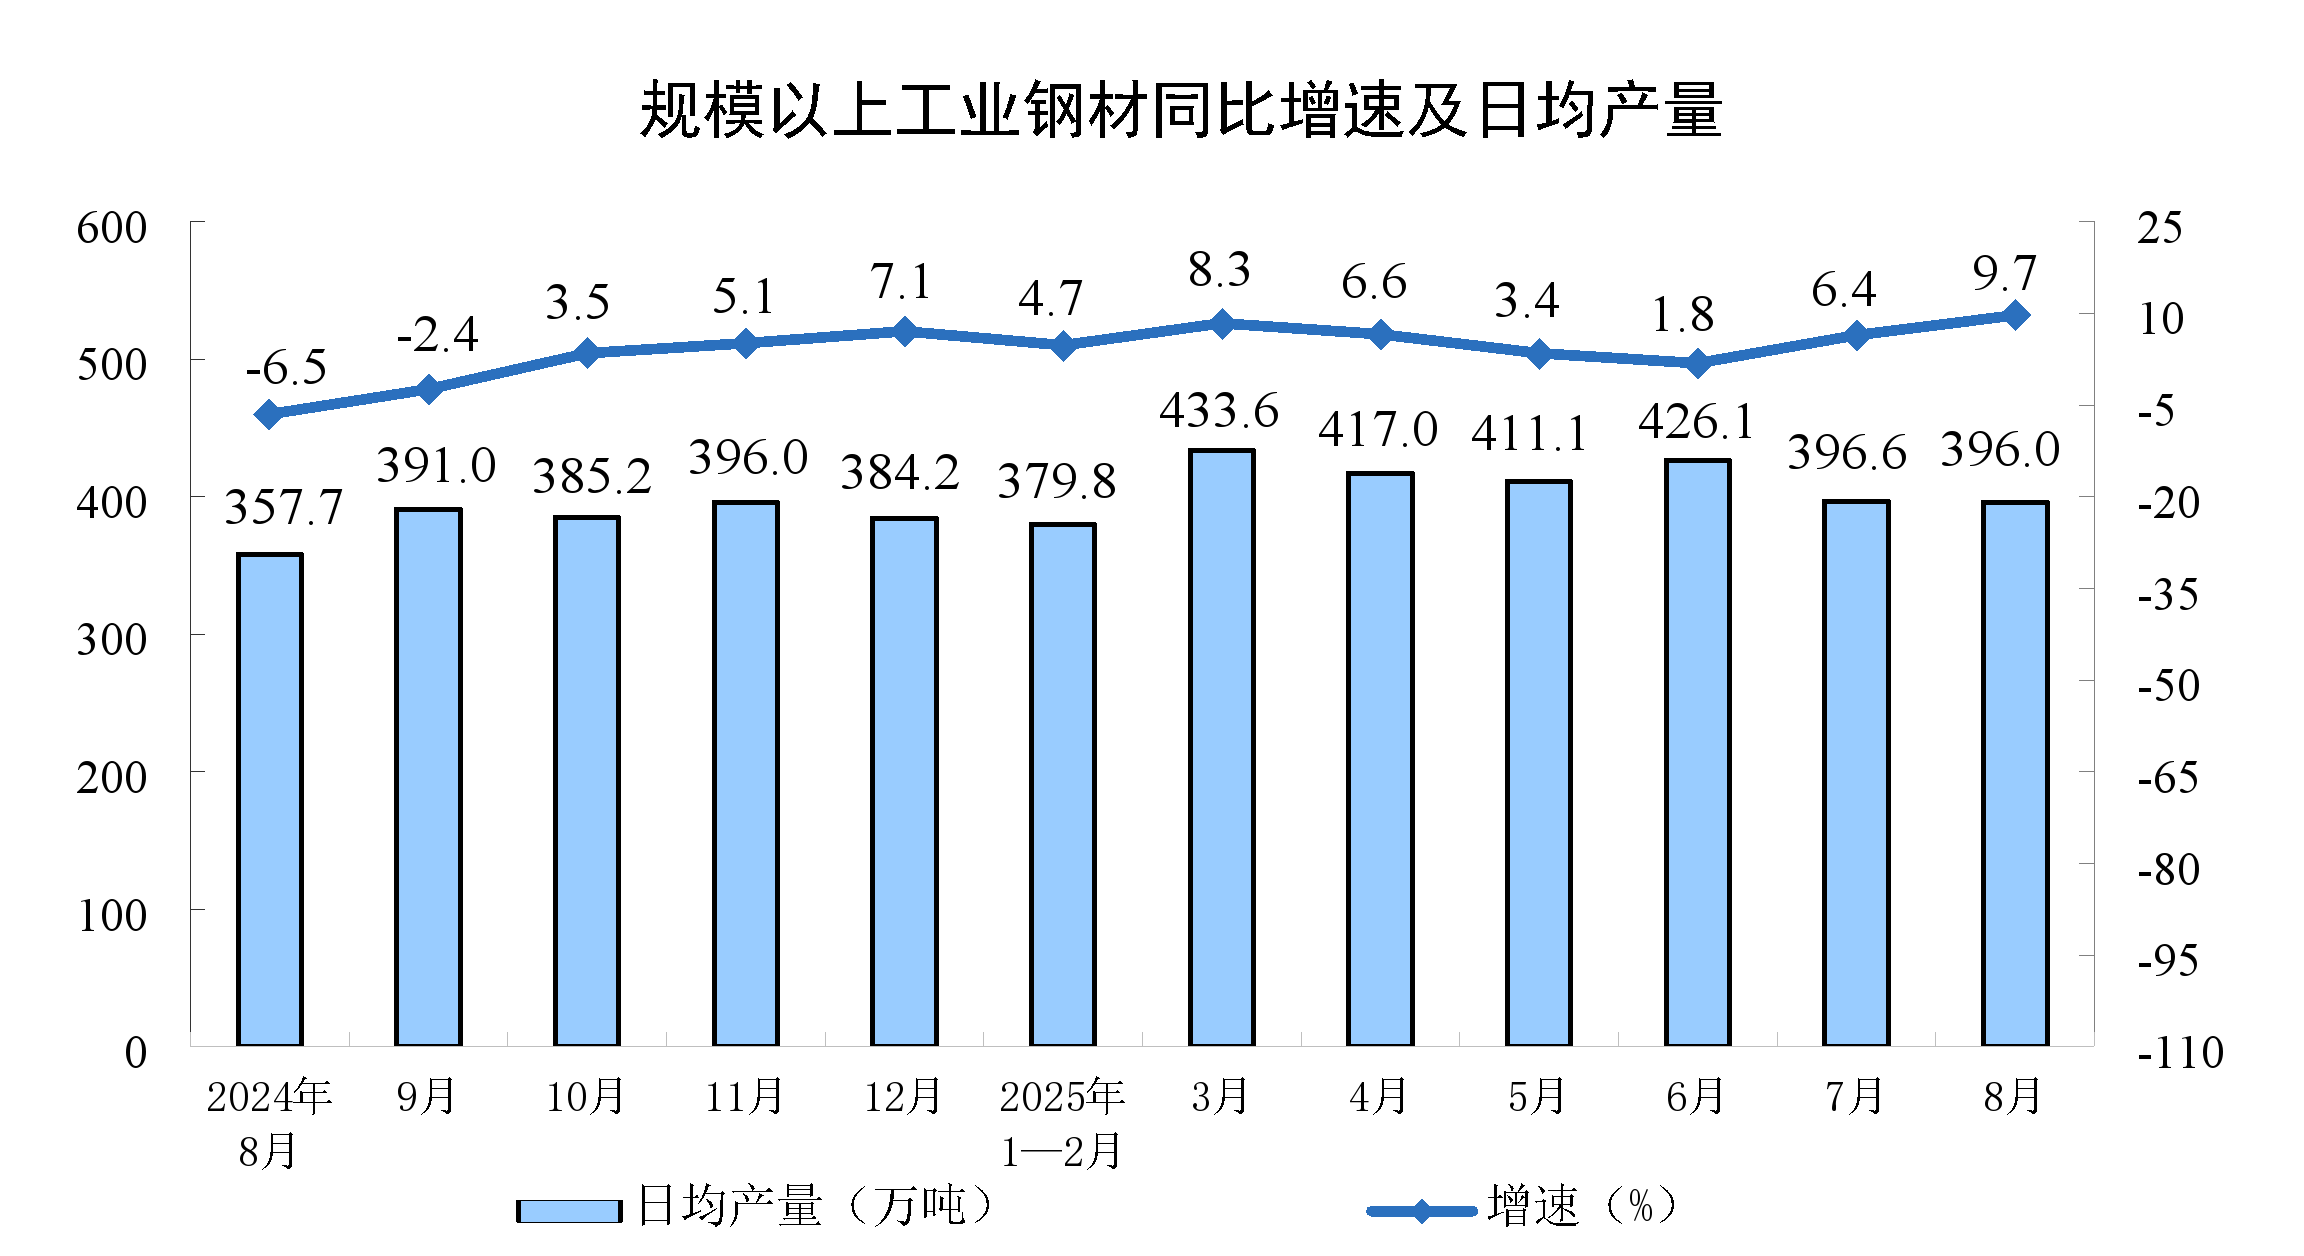
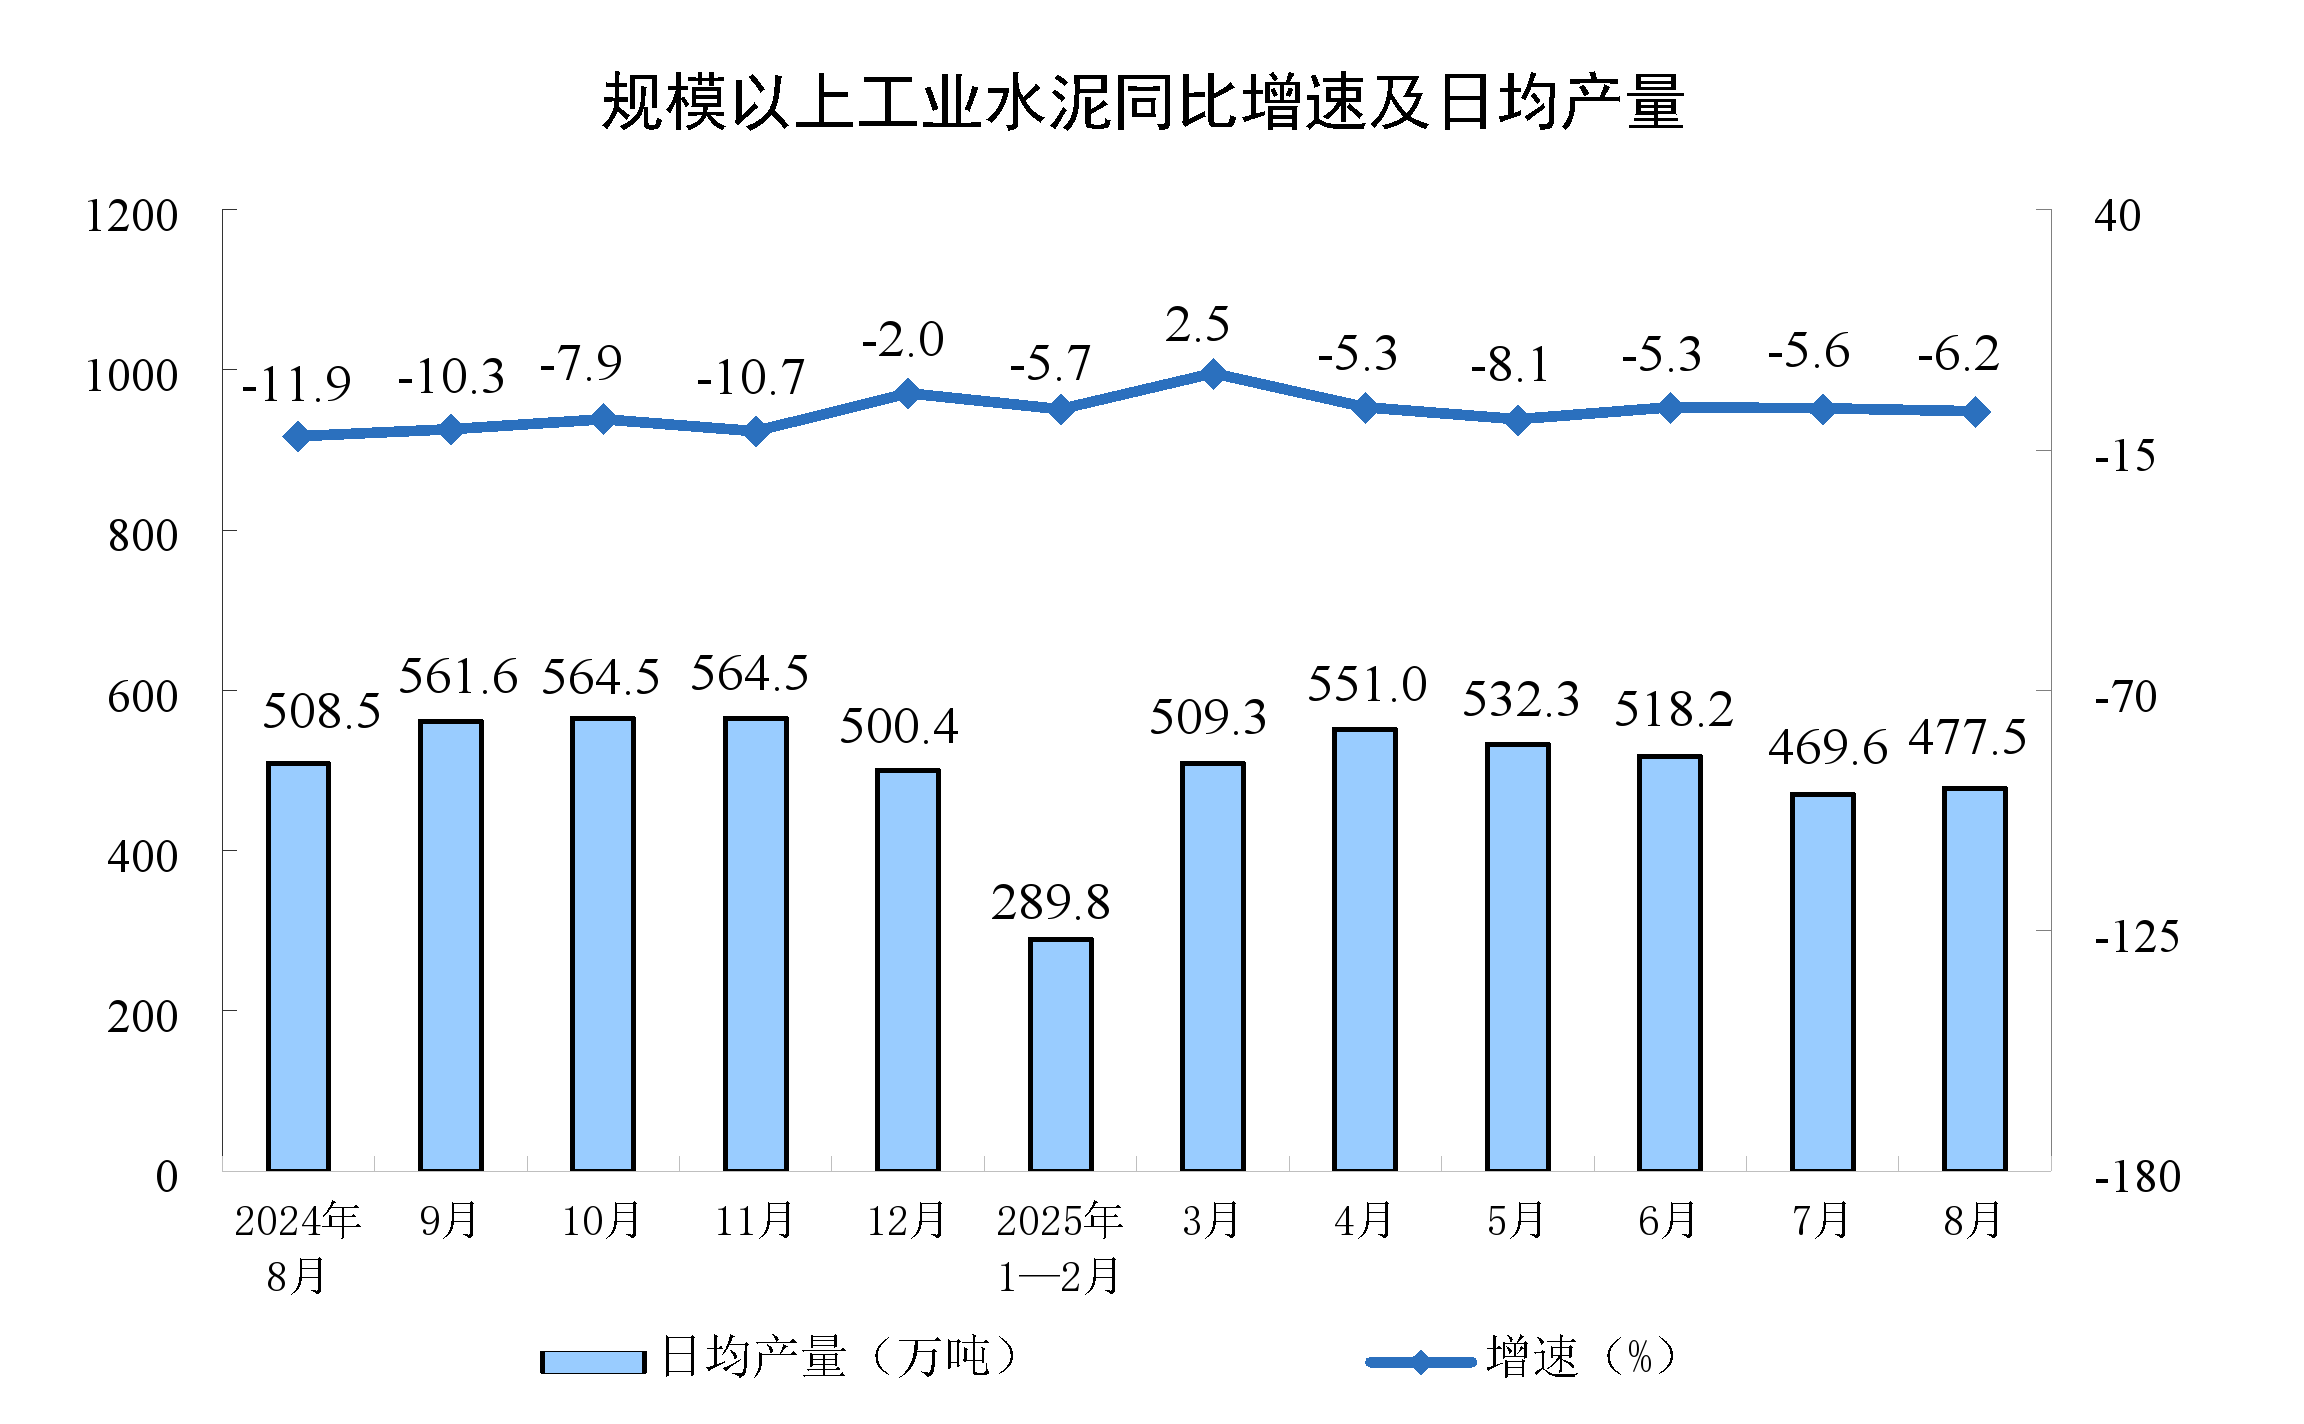
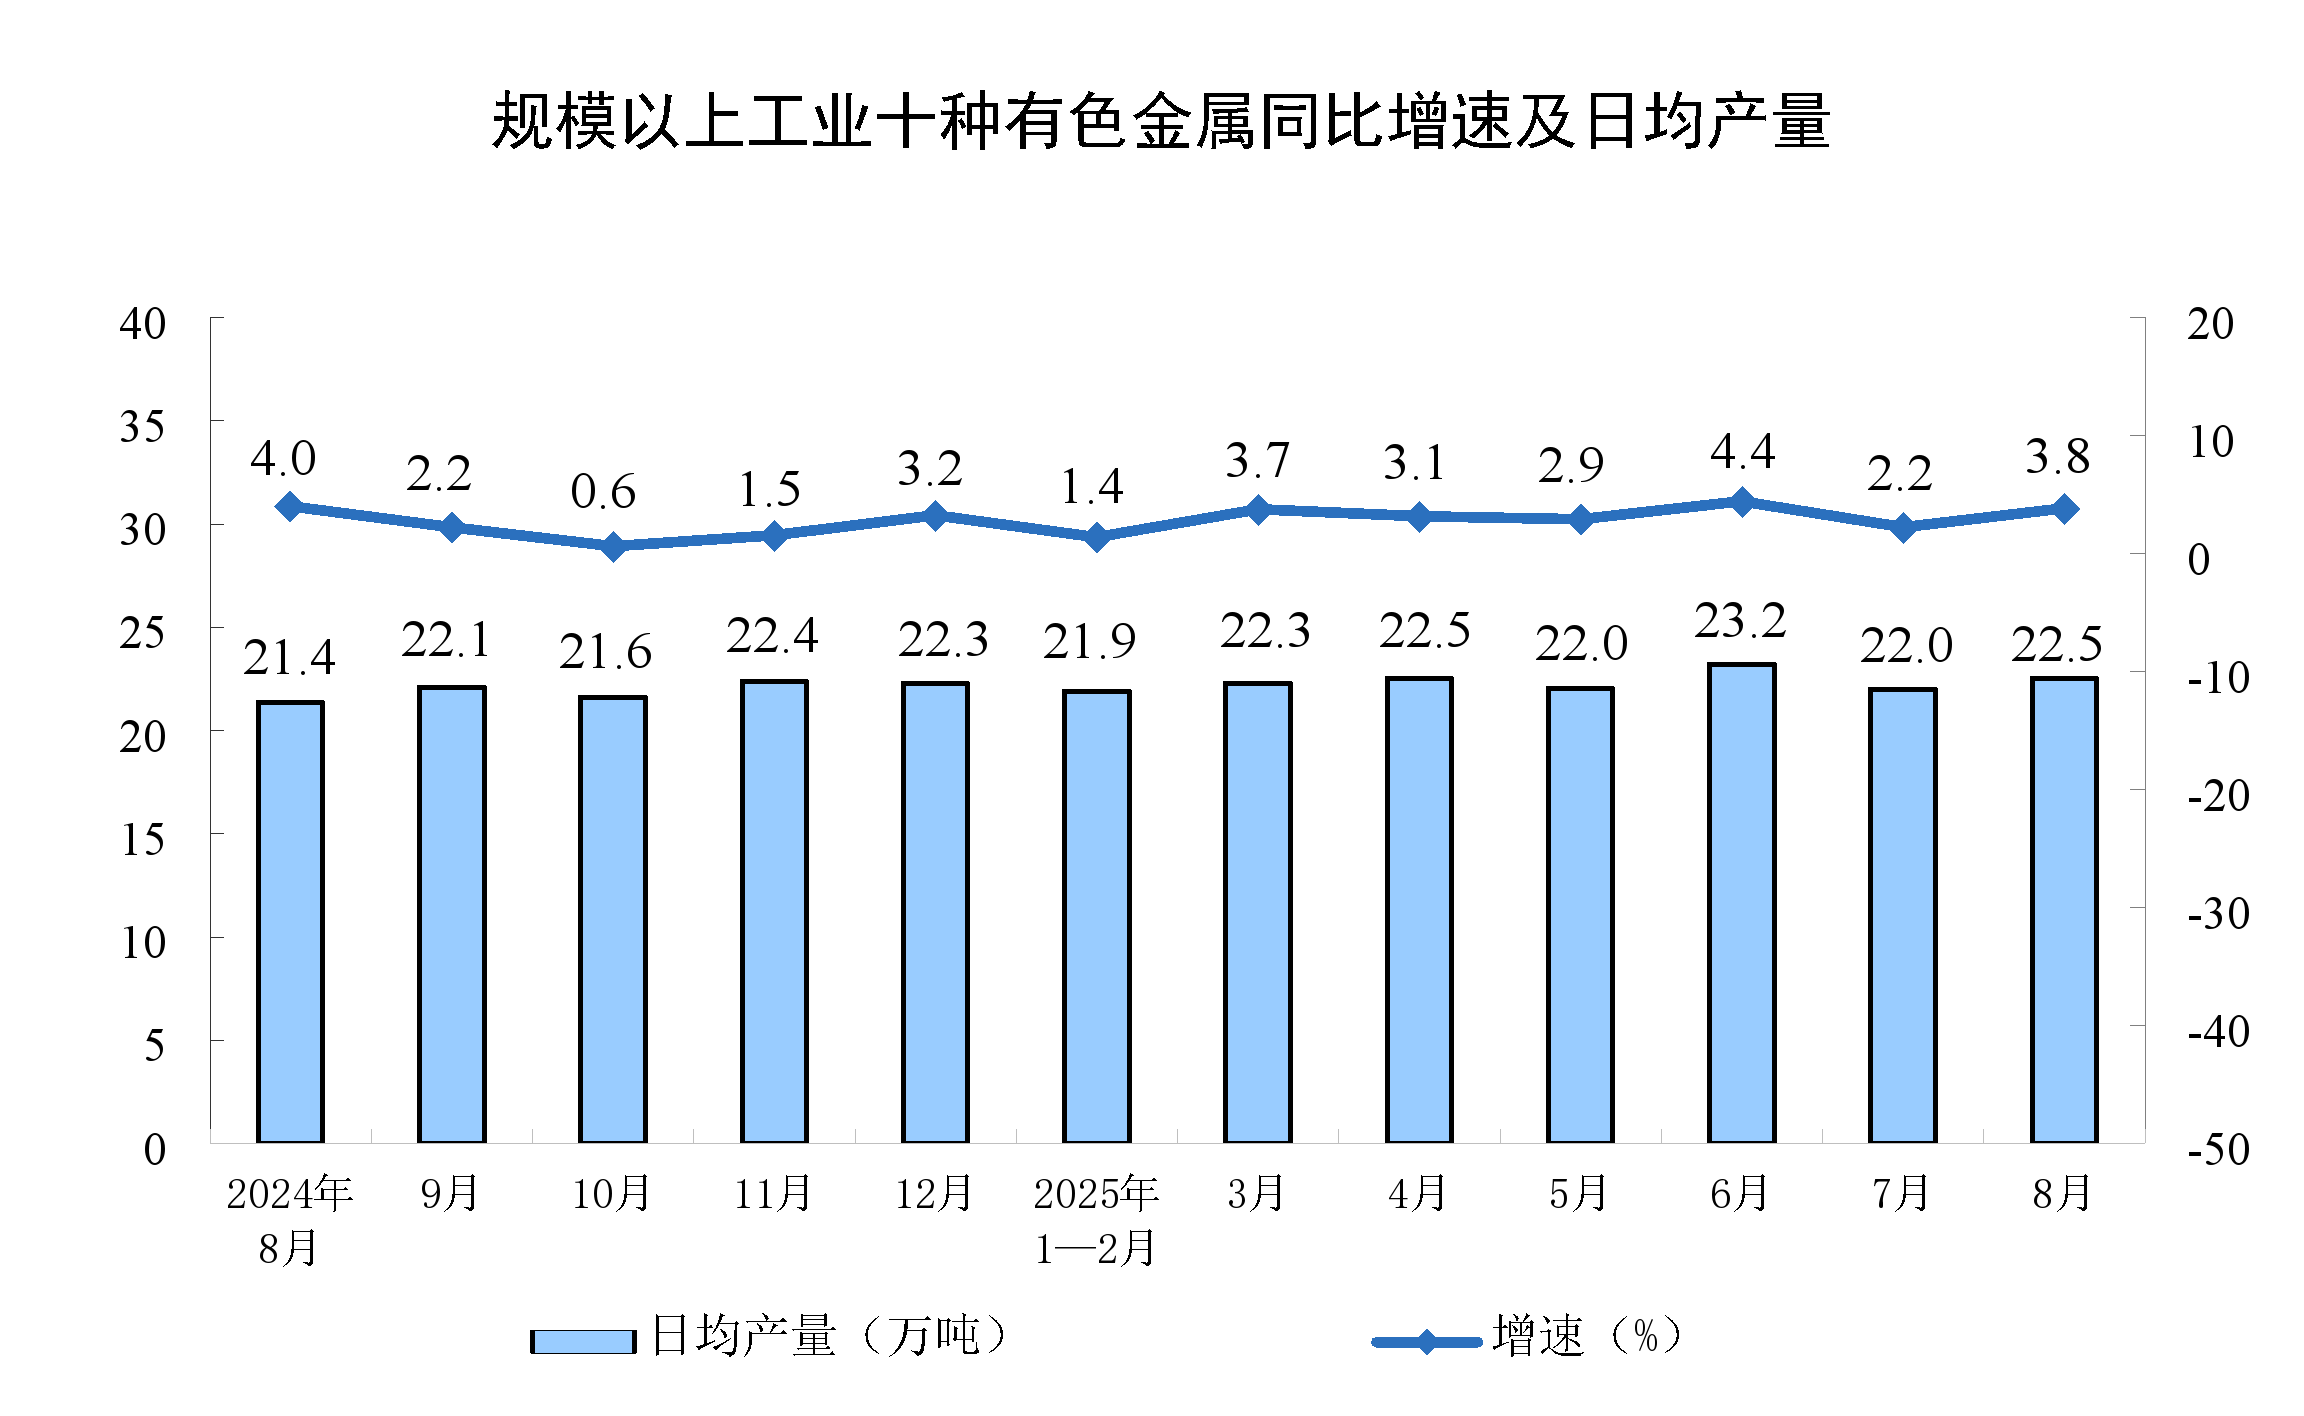
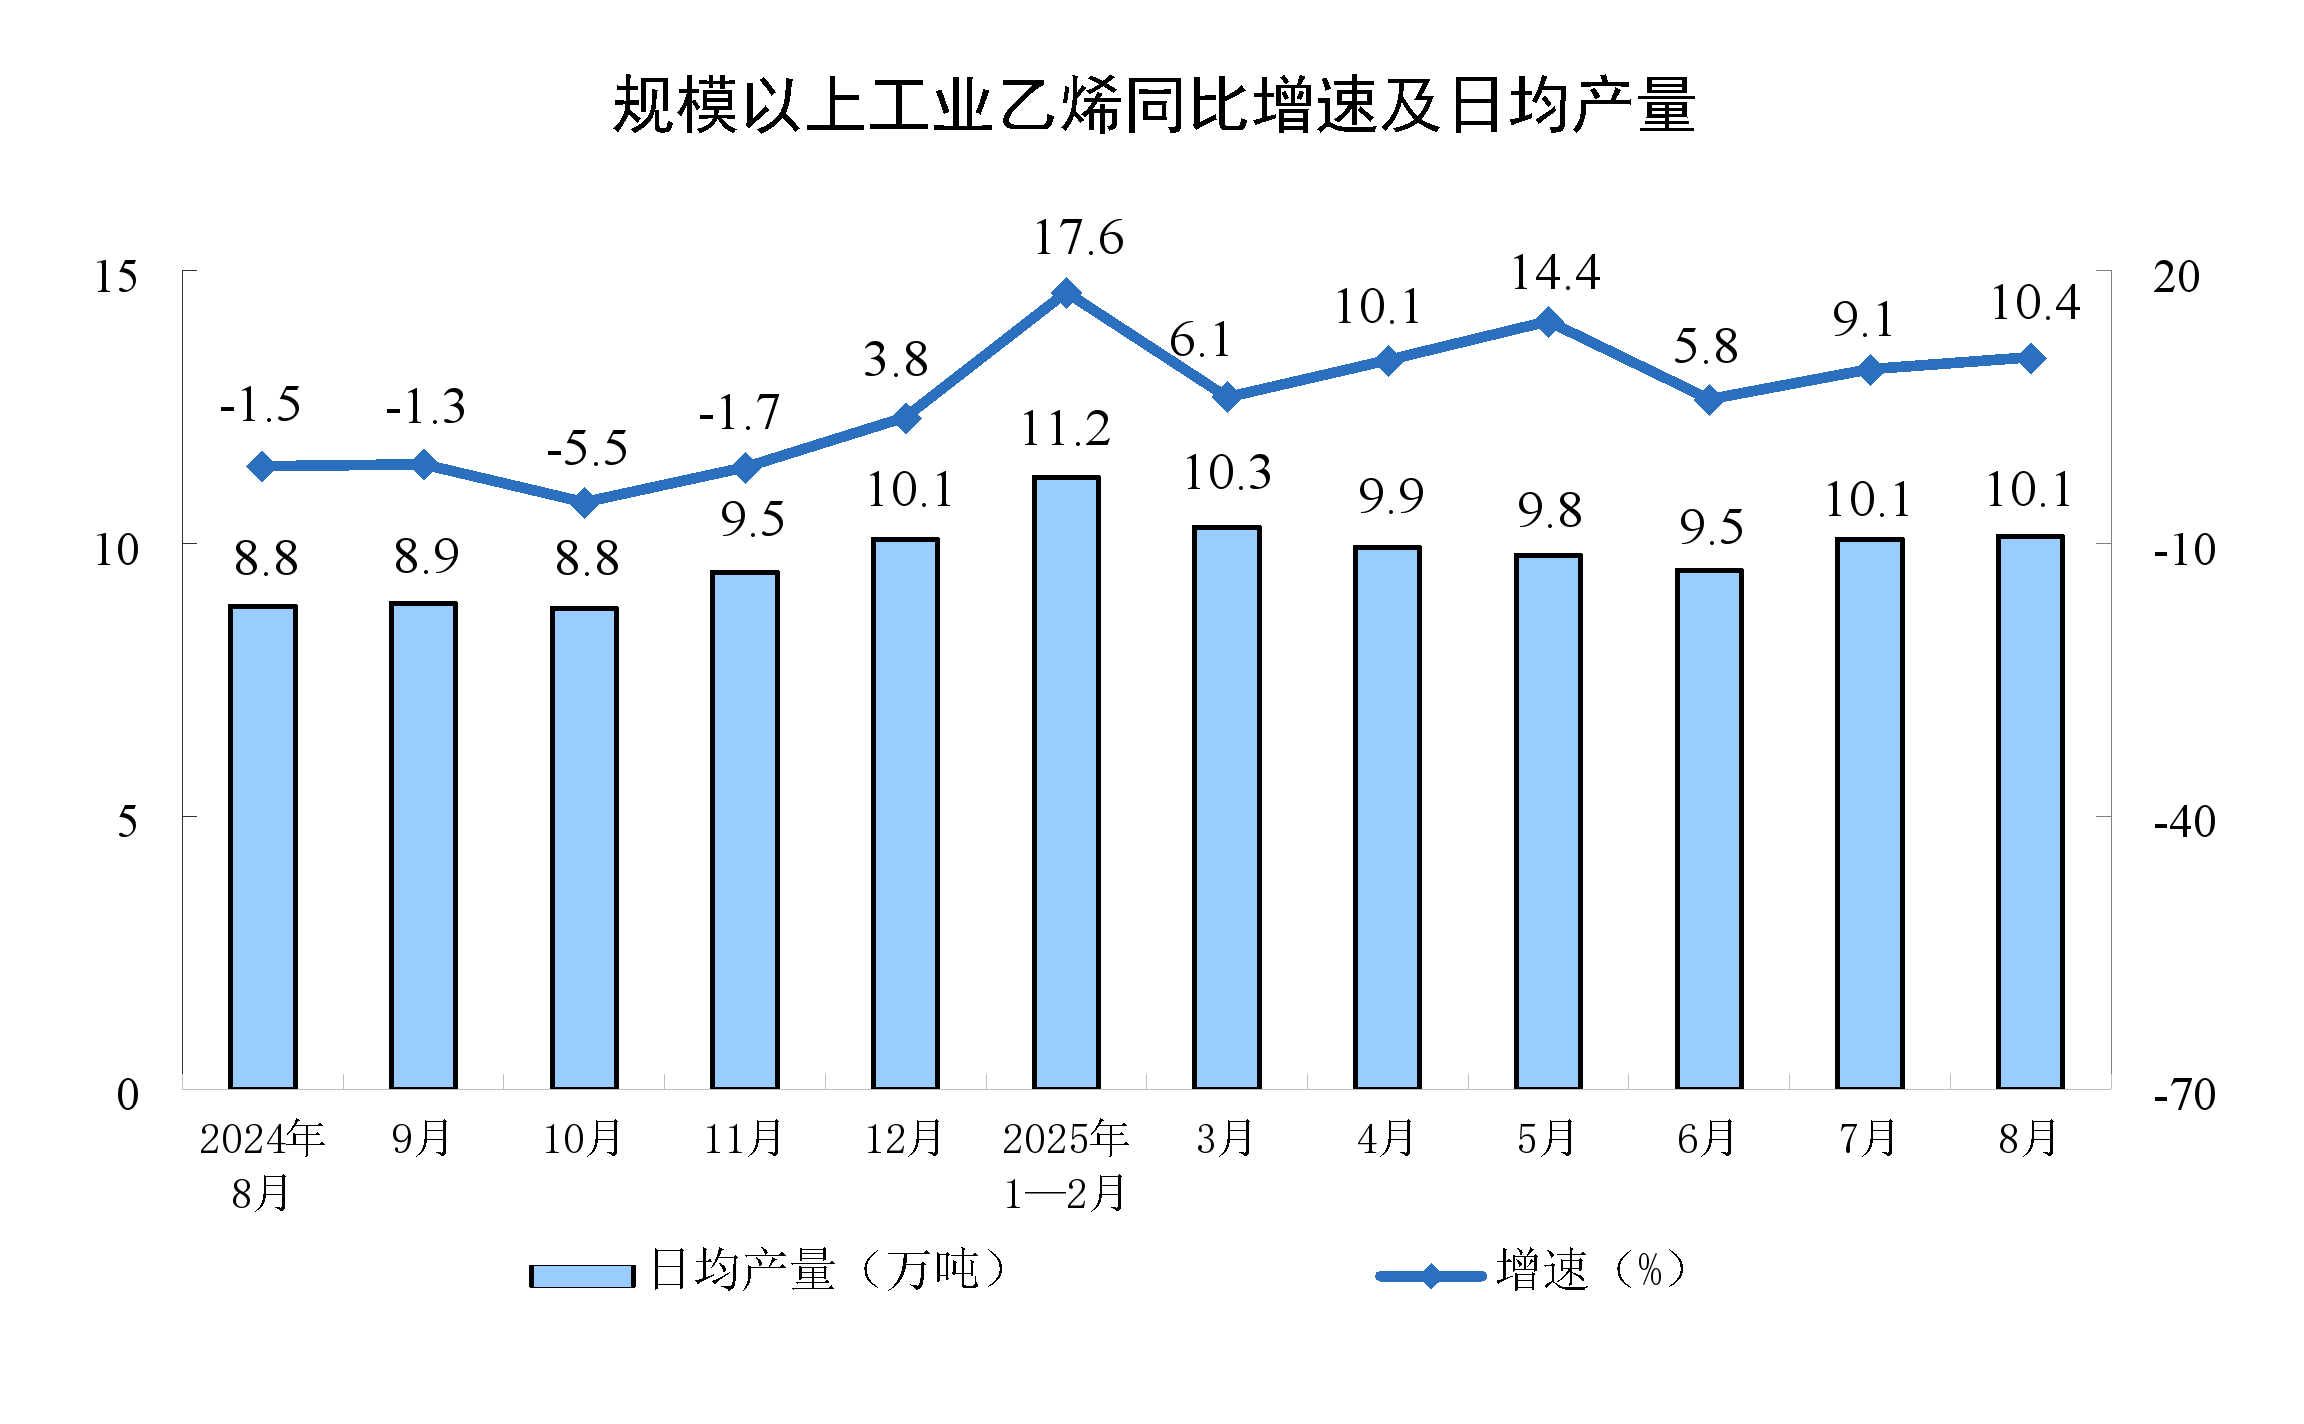
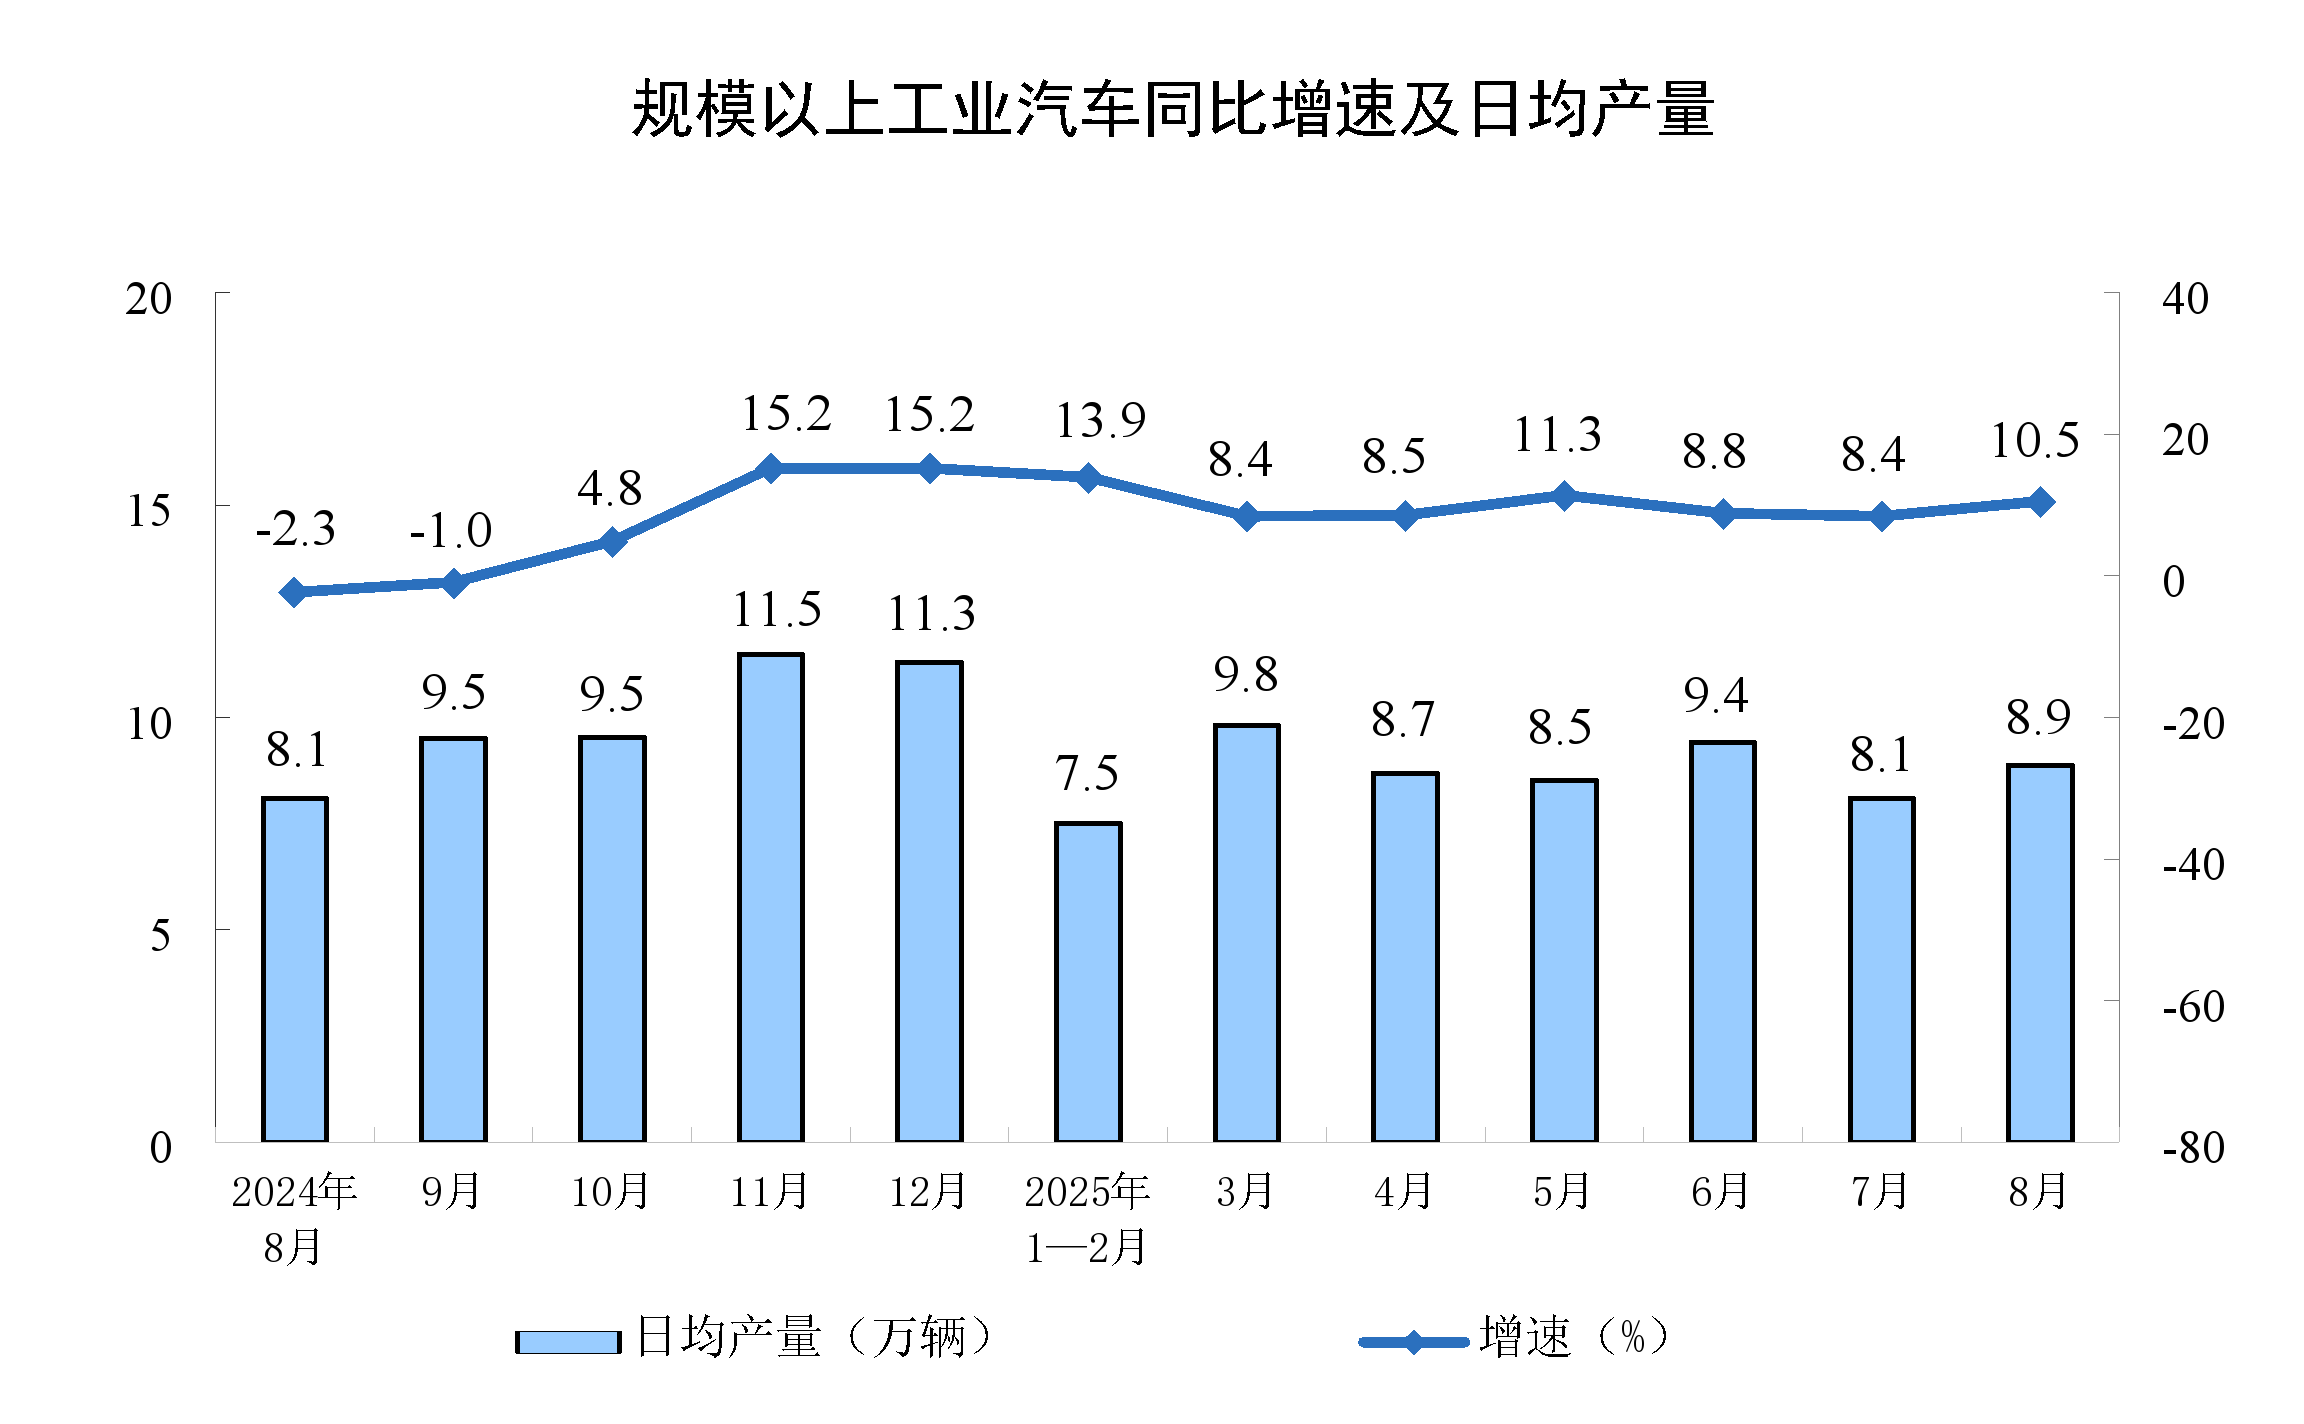
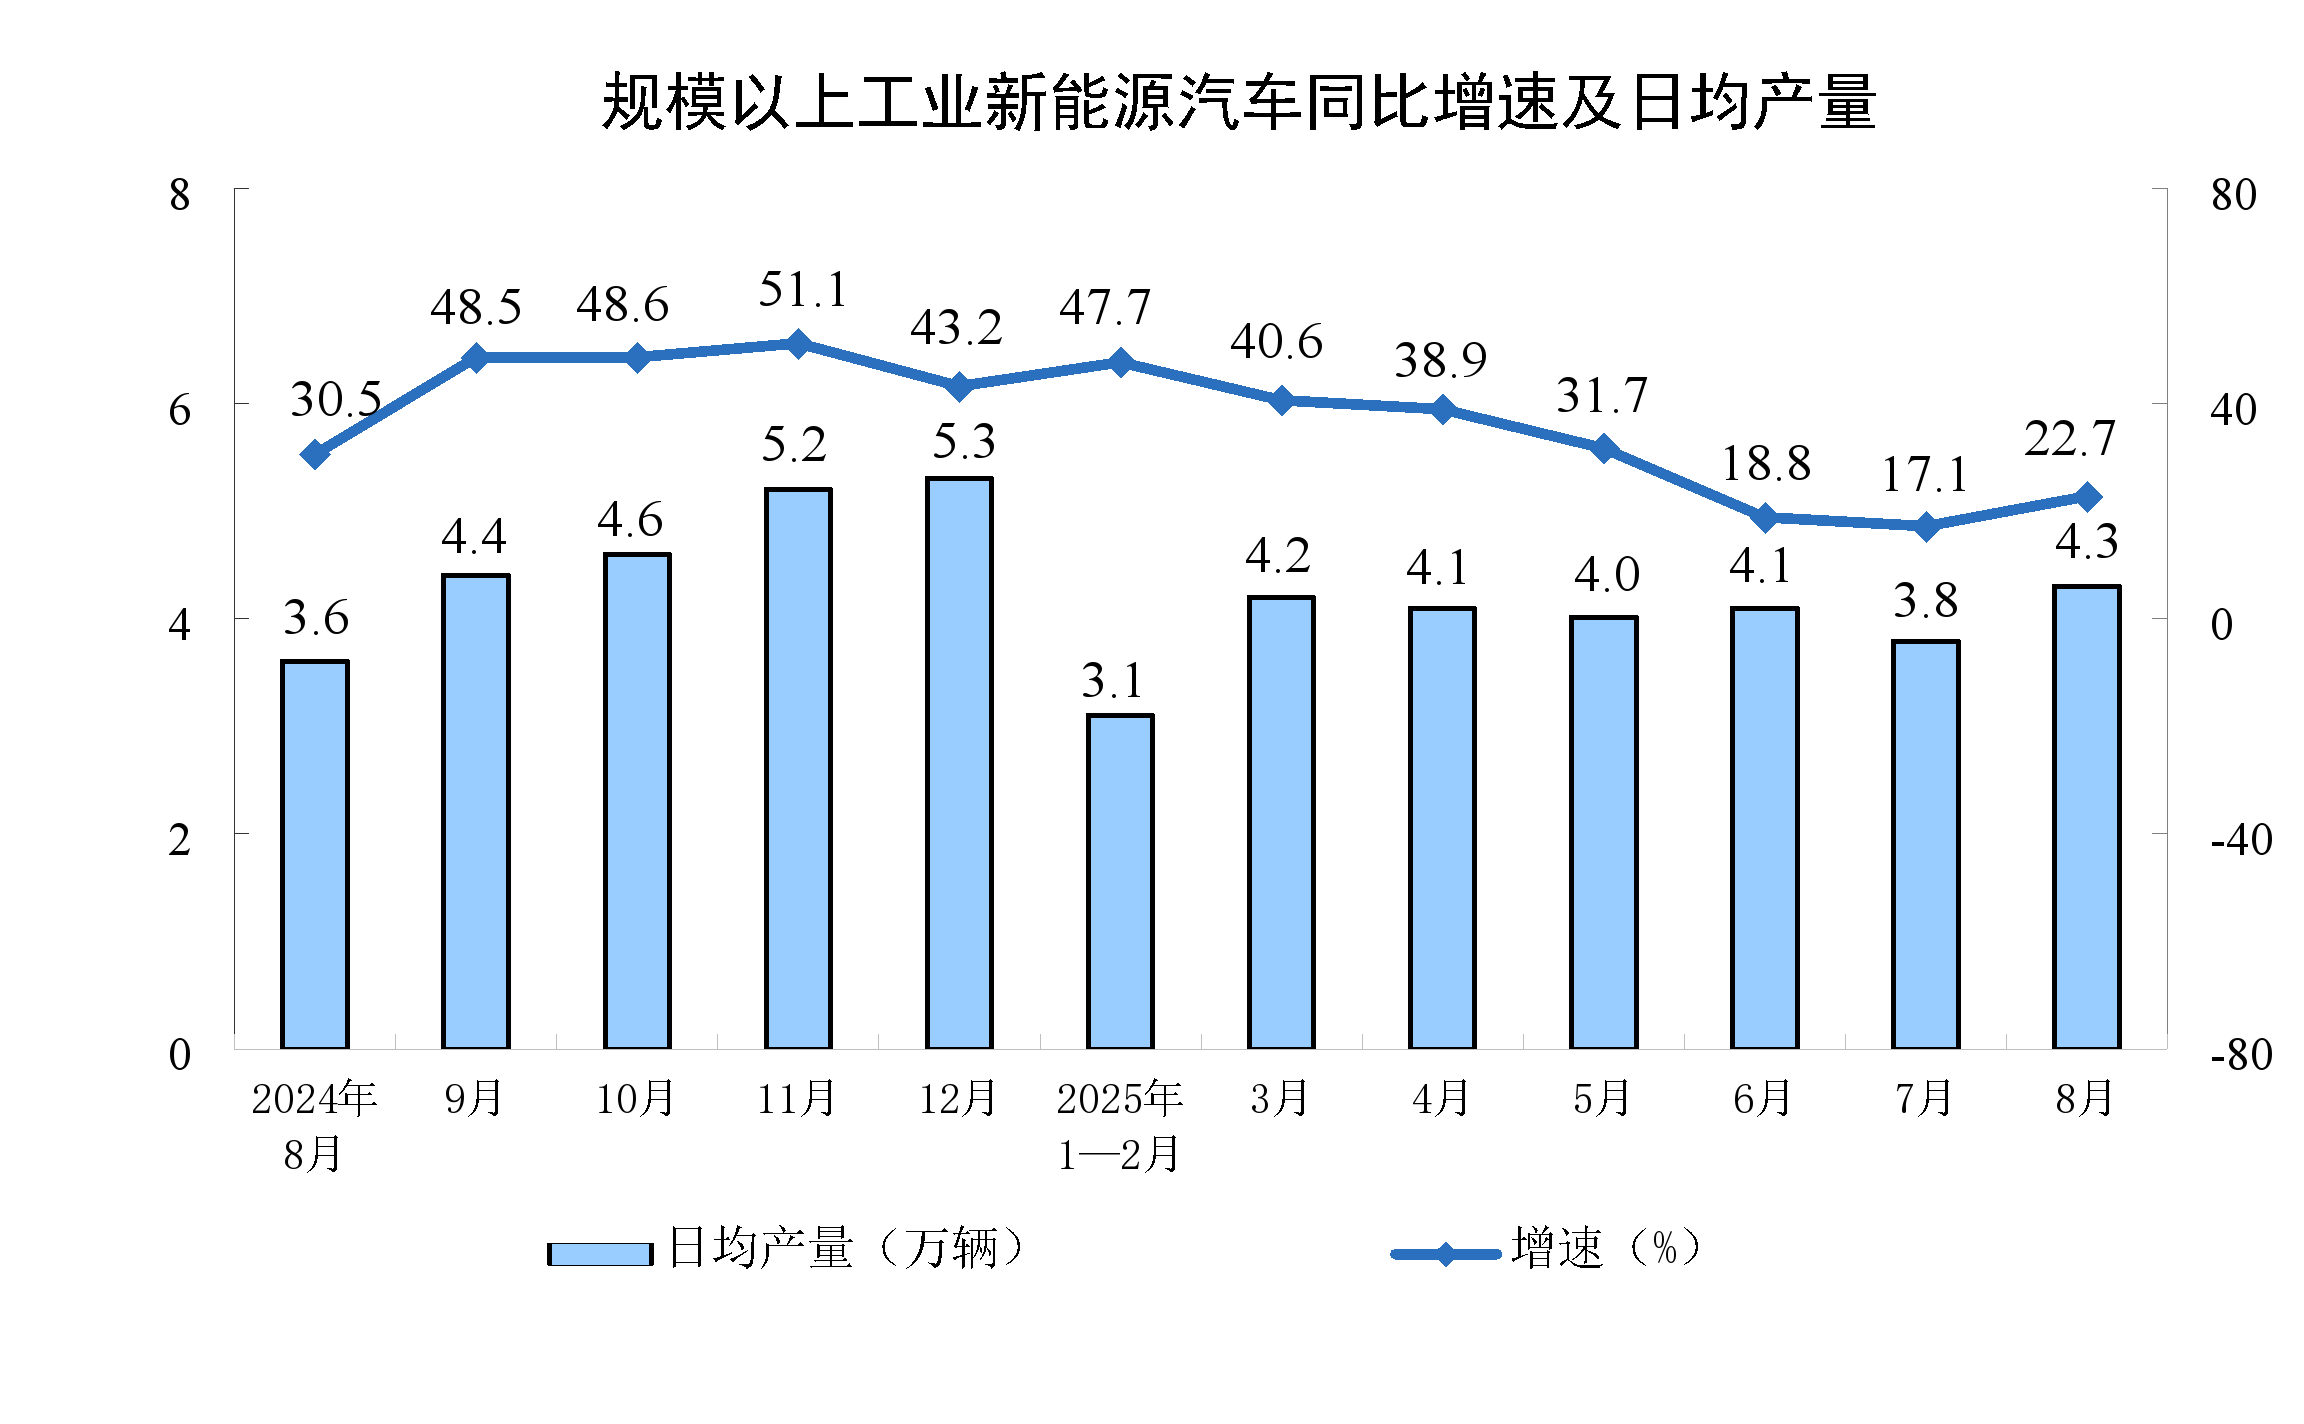
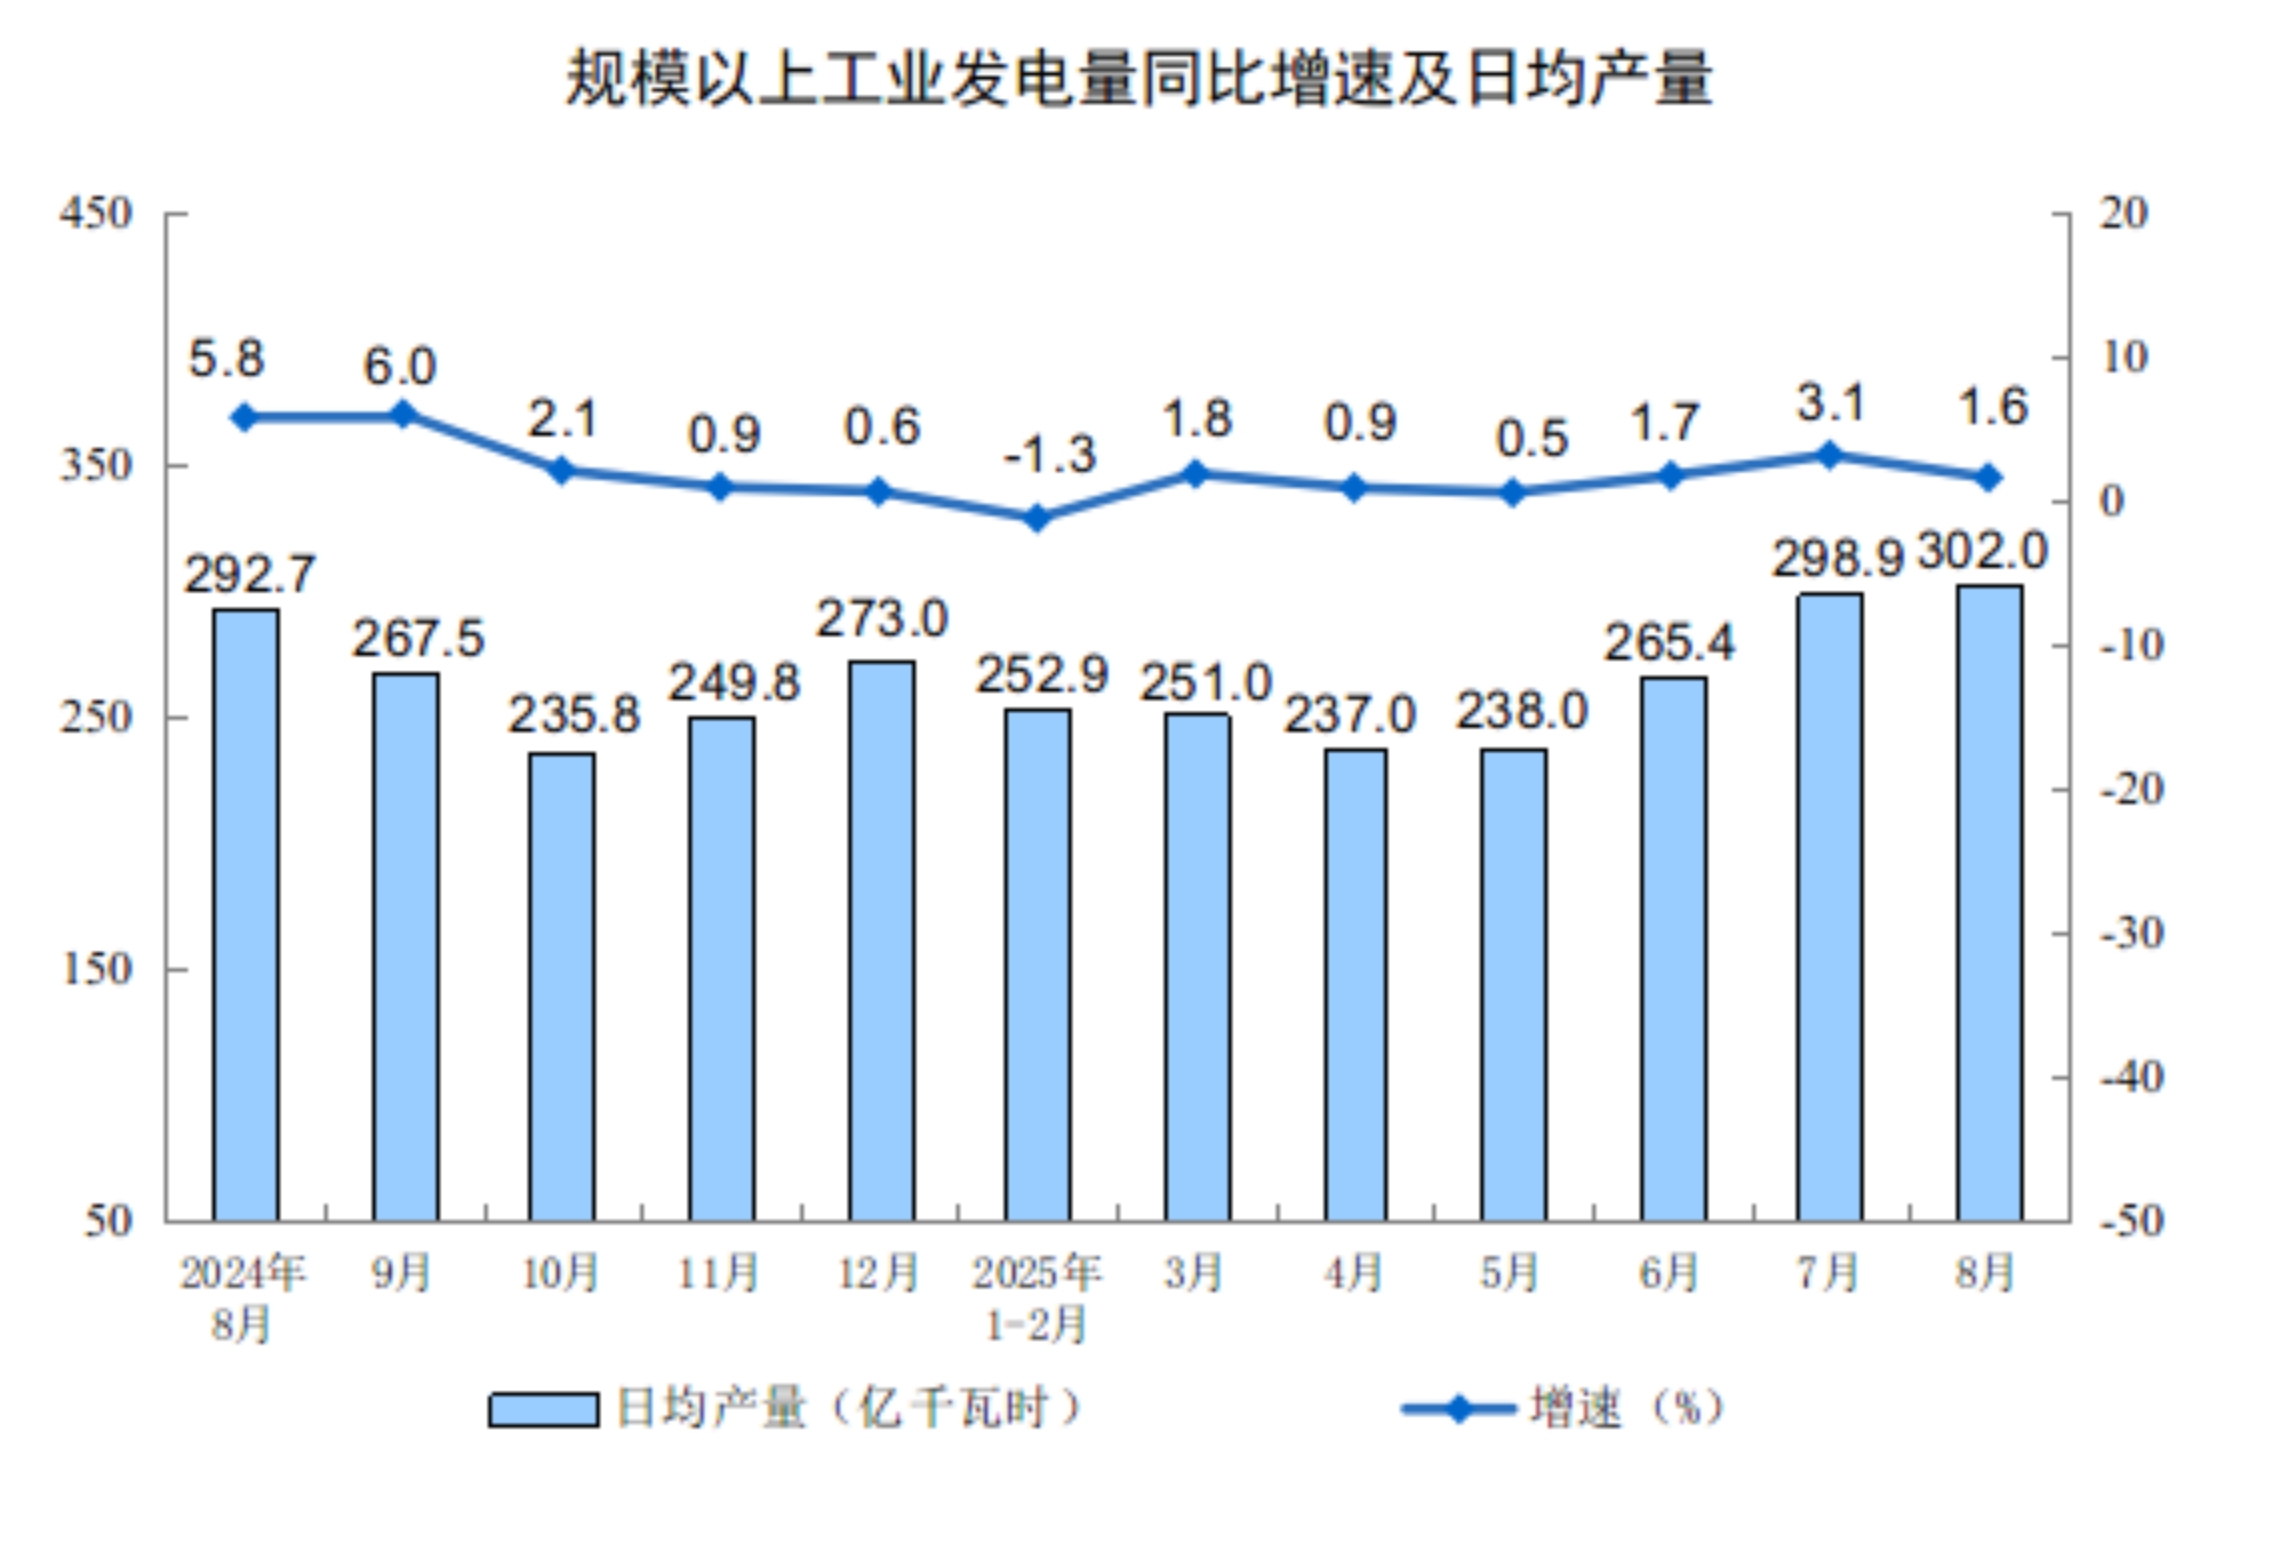
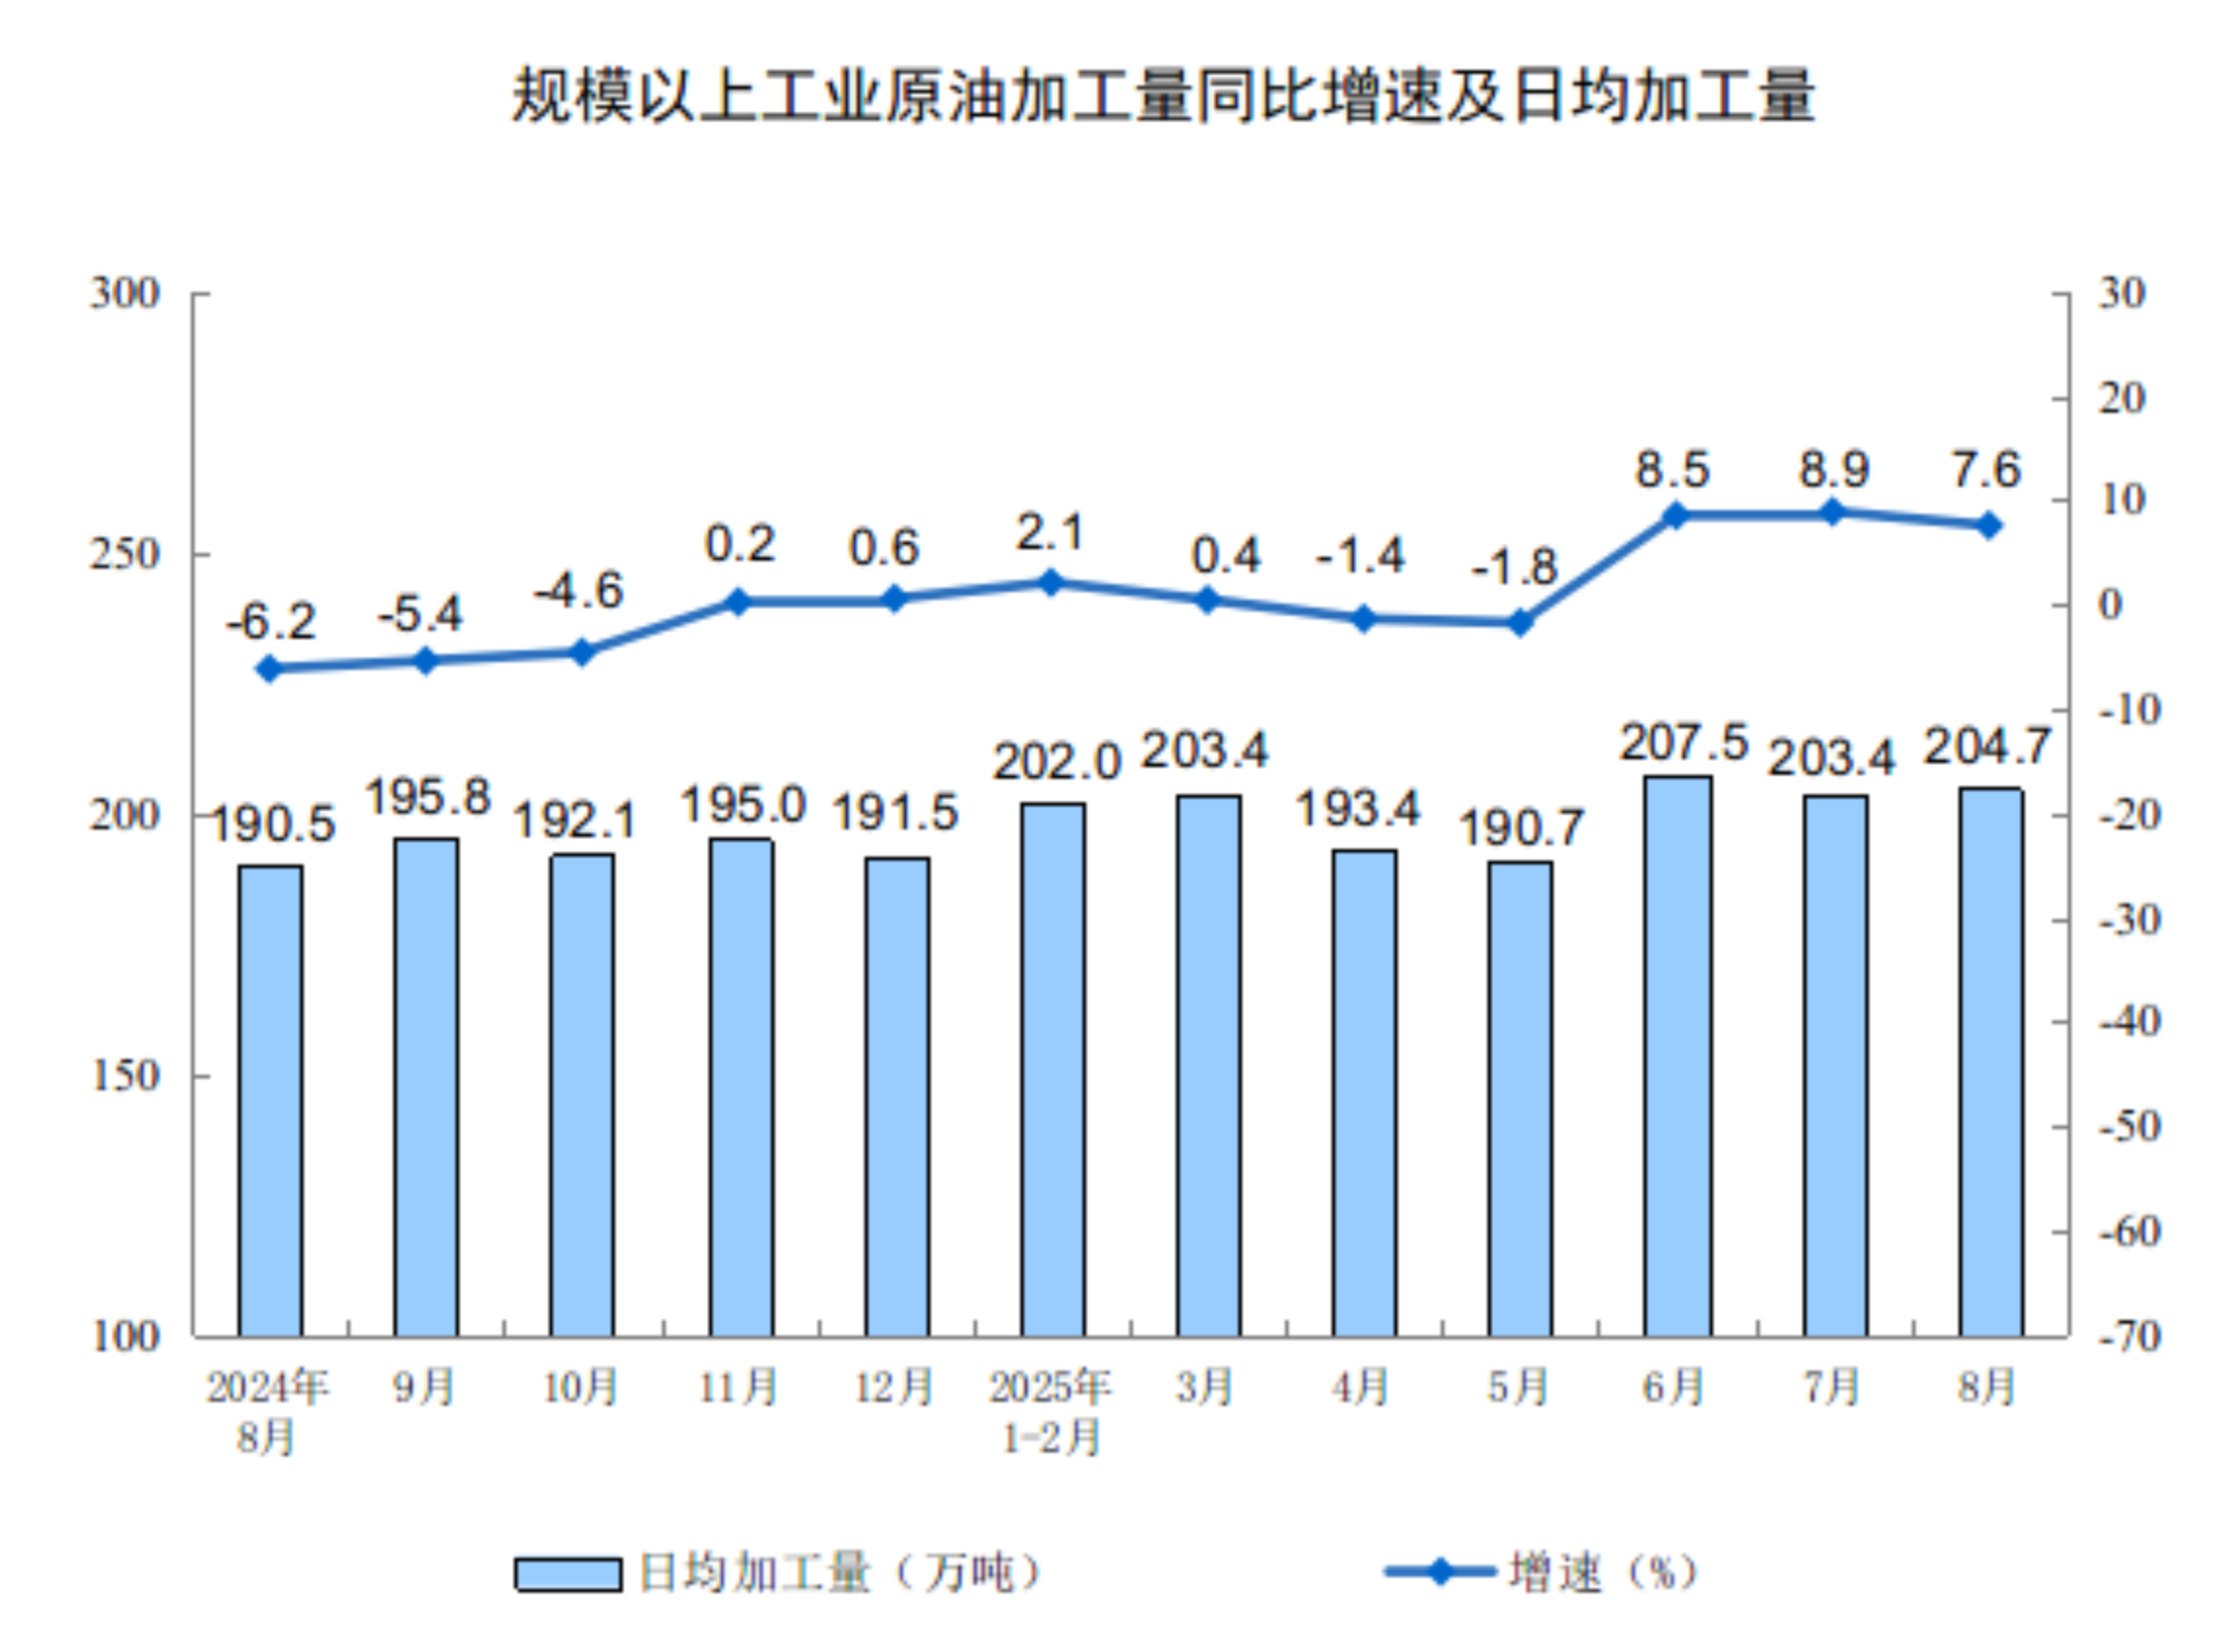
In terms of individual products, in August, out of 623 products from large-scale industries, 319 products saw a year-on-year increase in output. Among them, steel was at 122.77 million tons, an increase of 9.7%; cement was at 148.02 million tons, a decrease of 6.2%; ten types of non-ferrous metals amounted to 6.98 million tons, an increase of 3.8%; ethylene reached 3.14 million tons, an increase of 10.4%; automobiles were at 2.752 million units, an increase of 10.5%, including 1.333 million new energy vehicles, an increase of 22.7%; electricity generation reached 936.3 billion kilowatt-hours, an increase of 1.6%; and crude oil processing was at 63.46 million tons, an increase of 7.6%.
In August, the product sales rate of industrial enterprises above designated size was 96.6%, a year-on-year decrease of 0.1 percentage points; the export delivery value of industrial enterprises above designated size reached 1,302.9 billion yuan, a nominal year-on-year decrease of 0.4%.
(2) In August, the national economy operated smoothly overall, maintaining stability while making progress.
In August, under the strong leadership of the Party Central Committee with Comrade Xi Jinping at its core, various regions and departments earnestly implemented the decisions and deployments of the Party Central Committee and the State Council. They adhered to the general principle of pursuing progress while maintaining stability, fully and accurately implemented the new development philosophy, accelerated the establishment of a new development pattern, actively strengthened macro policy regulation, and advanced the construction of a unified national market. Efforts were made to enhance the domestic cycle, ensuring that production and demand remained generally stable, employment and prices were overall stable, new drivers of growth were cultivated and expanded, and the national economy maintained a stable and improving development trend.
Industrial production grew rapidly, with equipment manufacturing and high-tech manufacturing showing strong momentum.
In August, the added value of industrial enterprises above designated size nationwide increased by 5.2% year-on-year and 0.37% month-on-month. Looking at the three major categories, the added value of the mining industry increased by 5.1% year-on-year, the manufacturing industry grew by 5.7%, and the electricity, heat, gas, and water production and supply industries grew by 2.4%. The added value of equipment manufacturing increased by 8.1% year-on-year, and the added value of high-tech manufacturing grew by 9.3%, which is 2.9 and 4.1 percentage points faster than the total industrial added value above designated size, respectively. In terms of economic types, the added value of state-controlled enterprises increased by 4.7% year-on-year; joint-stock enterprises grew by 6.0%, foreign and Hong Kong, Macao, and Taiwan-invested enterprises grew by 2.3%; private enterprises grew by 4.6%. In terms of products, the output of 3D printing equipment, new energy vehicles, and industrial robots increased by 40.4%, 22.7%, and 14.4% year-on-year, respectively. From January to August, the added value of industrial enterprises above designated size nationwide increased by 6.2% year-on-year. In August, the manufacturing purchasing managers' index was 49.4%, up 0.1 percentage points from the previous month; the enterprise production and business activity expectation index was 53.7%, up 1.1 percentage points. From January to July, the total profit of industrial enterprises above designated size nationwide was 4,020.4 billion yuan, a year-on-year decrease of 1.7%.
2. The service industry is growing rapidly, and the development of modern services is progressing well.
In August, the national Index of Services Production increased by 5.6% year-on-year. By industry, the production indices for information transmission, software and information technology services, financial services, and leasing and business services grew by 12.1%, 9.2%, and 7.4% year-on-year respectively, which were 6.5, 3.6, and 1.8 percentage points higher than the overall services production index. From January to August, the national Index of Services Production increased by 5.9% year-on-year. From January to July, business revenue of service enterprises above designated size grew by 7.4% year-on-year. In August, the Business Activity Index for the service sector was 50.5%, up by 0.5 percentage points from the previous month; the Business Activity Expectation Index for the service sector was 57.0%, up by 0.4 percentage points. Among them, the business activity indices for industries such as railway transportation, waterway transportation, air transportation, telecommunications, broadcasting, television and satellite transmission services, and capital market services were all above 60.0%, indicating a high level of prosperity.
The market sales grew steadily, and service retail grew rapidly.
In August, the total retail sales of consumer goods reached 3,966.8 billion yuan, an increase of 3.4% year-on-year; it grew by 0.17% month-on-month. By the location of the operating units, the retail sales of consumer goods in urban areas amounted to 3,438.7 billion yuan, a year-on-year increase of 3.2%, while in rural areas it was 528.1 billion yuan, a growth of 4.6%. By type of consumption, the retail sales of goods reached 3,517.2 billion yuan, an increase of 3.6%, and catering revenue was 449.6 billion yuan, growing by 2.1%. Sales of basic living goods and some upgraded categories showed good growth momentum. Retail sales of daily necessities, grain and oil food, and sports and entertainment goods in units above the designated size increased by 7.7%, 5.8%, and 16.9% respectively. The policy of exchanging old items for new ones continues to show effects, with retail sales of furniture, household appliances and audio-visual equipment, cultural office supplies, and communication equipment in units above the designated size increasing by 18.6%, 14.3%, 14.2%, and 7.3% respectively. From January to August, the total retail sales of consumer goods reached 32,390.6 billion yuan, an increase of 4.6% year-on-year. The national online retail sales were 9,982.8 billion yuan, up by 9.6% year-on-year. Among them, the online retail sales of physical goods amounted to 8,096.4 billion yuan, a growth of 6.4%, accounting for 25.0% of the total retail sales of consumer goods. From January to August, service retail sales increased by 5.1% year-on-year. Among them, the retail sales of cultural and leisure services, tourism consulting and rental services, and transportation services grew rapidly.
Fixed asset investment continued to grow, with manufacturing investment growing rapidly.
From January to August, the national fixed asset investment (excluding rural households) was 32.6111 trillion yuan, a year-on-year increase of 0.5%. Excluding real estate development investment, the national fixed asset investment grew by 4.2%. By sector, infrastructure investment increased by 2.0% year-on-year, manufacturing investment grew by 5.1%, and real estate development investment decreased by 12.9%. The nationwide sales area of newly built commercial housing was 57.304 million square meters, down 4.7% year-on-year; the sales value of newly built commercial housing was 5.5015 trillion yuan, down 7.3%. By industry, investment in the primary industry increased by 5.5% year-on-year, investment in the secondary industry grew by 7.6%, and investment in the tertiary industry decreased by 3.4%. Private investment decreased by 2.3% year-on-year; excluding real estate development investment, private investment grew by 3.0%. In high-tech industries, investments in information services, aerospace and equipment manufacturing, and computer and office equipment manufacturing increased by 34.1%, 28.0%, and 12.6% year-on-year, respectively. In August, fixed asset investment (excluding rural households) decreased by 0.20% month-on-month.
The import and export of goods continue to grow, and the trade structure continues to optimize.
In August, the total value of imports and exports of goods was 3,874.4 billion yuan, an increase of 3.5% year-on-year. Exports were 2,303.5 billion yuan, an increase of 4.8%; imports were 1,570.9 billion yuan, an increase of 1.7%. From January to August, the total value of imports and exports of goods was 29,569.6 billion yuan, an increase of 3.5% year-on-year. Exports were 17,605.6 billion yuan, an increase of 6.9%; imports were 11,964 billion yuan, a decrease of 1.2%. From January to August, general trade imports and exports increased by 2.2%, accounting for 63.9% of the total import and export value. Imports and exports with countries involved in the "Belt and Road" initiative increased by 5.4%. Imports and exports by private enterprises increased by 7.4%, accounting for 57.1% of the total import and export value, an increase of 2.1 percentage points from the same period last year. Exports of mechanical and electrical products increased by 9.2%, accounting for 60.2% of the total export value.
The employment situation is generally stable, with the urban surveyed unemployment rate rising seasonally.
From January to August, the average surveyed urban unemployment rate nationwide was 5.2%. In August, the surveyed urban unemployment rate was 5.3%, up 0.1 percentage points from the previous month and unchanged from the same month last year. The surveyed unemployment rate for the local household registration labor force was 5.4%, while that for the non-local household registration labor force was 5.0%, with the surveyed unemployment rate for non-local agricultural household registration labor force being 4.7%. In 31 major cities, the surveyed urban unemployment rate was 5.3%, up 0.1 percentage points from the previous month and down 0.1 percentage points from the same month last year. The national average weekly working hours for employees in enterprises were 48.5 hours.
Core CPI continues to rise, and the decline in industrial producer prices has narrowed.
In August, the national consumer price index (CPI) for residents decreased by 0.4% year-on-year, remaining flat month-on-month. By category, prices for food, tobacco, and alcohol fell by 2.5% year-on-year; clothing prices rose by 1.8%; housing prices increased by 0.1%; prices for daily necessities and services rose by 1.8%; transportation and communication prices declined by 2.4%; education, culture, and entertainment prices increased by 1.0%; medical and healthcare prices rose by 0.9%; and prices for other goods and services increased by 8.6%. Within food, tobacco, and alcohol prices, pork prices dropped by 16.1%, fresh vegetable prices fell by 15.2%, fresh fruit prices decreased by 3.7%, and grain prices declined by 0.8%. The core CPI, which excludes food and energy prices, rose by 0.9% year-on-year, with the increase expanding by 0.1 percentage points compared to the previous month. From January to August, the national consumer price index for residents declined by 0.1% year-on-year.
In August, the national Producer Price Index (PPI) fell by 2.9% year-on-year, with the decline narrowing by 0.7 percentage points compared to the previous month, and remained flat month-on-month. The national Purchase Price Index for industrial producers decreased by 4.0% year-on-year, with the decline narrowing by 0.5 percentage points, and also remained flat month-on-month. From January to August, the national producer prices and purchase prices for industrial producers decreased by 2.9% and 3.3% year-on-year, respectively.
Overall, in August, macro policies worked in coordination, the national economy operated generally steadily, the transformation and upgrading progressed steadily, and new achievements were made in high-quality development. It should also be noted that the external environment remains fraught with many unstable and uncertain factors, and China's economic operation still faces numerous risks and challenges. In the next stage, we must adhere to Xi Jinping Thought on Socialism with Chinese Characteristics for a New Era as the guiding principle, uphold the general tone of seeking progress while maintaining stability, fully and accurately implement the new development philosophy, accelerate the construction of a new development pattern, thoroughly implement various macro policies, focus on stabilizing employment, enterprises, markets, and expectations, deepen reform, opening-up, and innovation, stimulate the vitality of various market entities, and promote steady and healthy economic development.
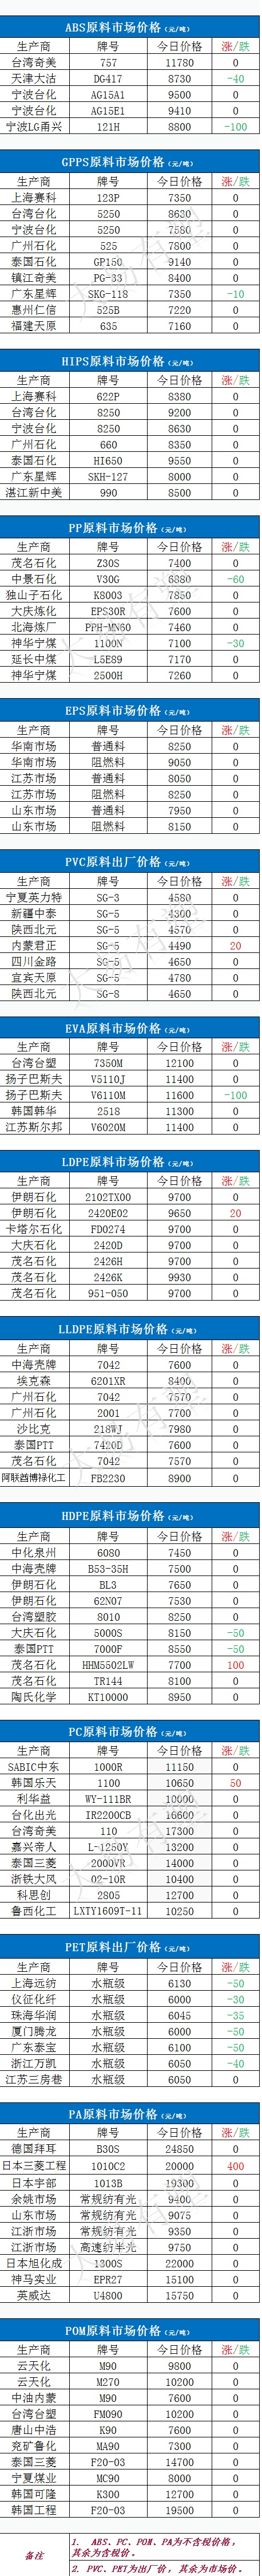
2. Latest Plastic Prices Today
(The above is compiled from Cailian Press and Dayi YouSu.)
【Copyright and Disclaimer】The above information is collected and organized by PlastMatch. The copyright belongs to the original author. This article is reprinted for the purpose of providing more information, and it does not imply that PlastMatch endorses the views expressed in the article or guarantees its accuracy. If there are any errors in the source attribution or if your legitimate rights have been infringed, please contact us, and we will promptly correct or remove the content. If other media, websites, or individuals use the aforementioned content, they must clearly indicate the original source and origin of the work and assume legal responsibility on their own.
Most Popular
-

AI Computing Power Demand Ignites Electronic Fabrics! China Jushi Hits Limit Up! Domestic Substitution Welcomes Golden Window
-

Focus on going global! kingfa sci. leads, huitong, preter, and kumho nire follow, china’s modified plastics frenziedly expanding worldwide
-

PA66 Cost and Profit: Broad-Based Weakness in the Feedstock Market Continues to Erode Cost Support for PA66 (202606)
-

Back-to-back major joker moves! covestro’s 1.32 million ton mdi dual-line expansion and hdi acquisition reshape global polyurethane landscape
-

Evonik Parts Ways With The Polyester Business! A Strategic Retreat By A Germany Chemical Giant And The Global Industry Shift


