


China TV Market September Shipments at 2.92 Million Units, Down 8.5% Year-on-Year
DoNews, October 12th – Lotu Technology has released the shipment data for September for the Chinese TV market. Last month, the total shipment volume of TV sets in the Chinese market was 2.92 million units, a decrease of 8.5% compared to the same period last year, but an increase of 17.3% compared to August.
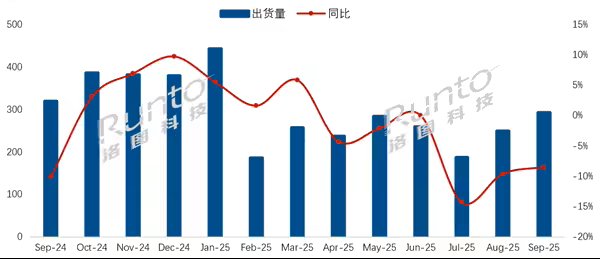
In the three months of the third quarter, shipments in the Chinese market consecutively decreased year-on-year, with a significant decline of around 10%. The month-on-month growth in September indicates that the traditional sales peak season is arriving, and manufacturers are accelerating their stocking pace.
In total, the brand's overall shipment volume in the third quarter this year was 7.27 million units, a year-on-year decrease of 10.4%; the cumulative shipment volume for the first three quarters was 23.895 million units, a decrease of 2.5% compared to the same period last year.
In terms of brand landscape, by September 2025, the total shipment volume of the top eight leading brands in the Chinese TV market, namely Hisense, TCL, Skyworth, Xiaomi, Changhong, Haier, Konka, and Huawei, along with their sub-brands, is approximately 2.813 million units, a year-on-year decrease of 5.8%, which is smaller than the overall market decline, with a combined market share of over 95%.
In September, the combined market share of three traditional leading brands, Hisense, TCL, and Skyworth (including sub-brands), was 62.0%, with a shipment volume of approximately 1.81 million units, showing a slight year-on-year decline of only 0.5%. The phenomenon of strong players remaining strong and the market concentrating towards the leading brands is quite evident. Xiaomi (including REDMI TVs) had a shipment volume of about 500,000 units in September, with a market share of 17.1%.
After the TOP4, the combined shipment volume of the brands Changhong, Haier, and Konka in September was approximately 440,000 units, a year-on-year decline of 14.0%, with a combined market share of 15.2%.
Huawei's cumulative shipment volume so far this year is approximately 700,000 units, showing a slight decrease compared to last year, with an expected total shipment volume of under one million units for the entire year. The four major foreign brands—Samsung, Sony, Sharp, and Philips—continued to maintain their respective shipment volumes at relatively low levels of tens of thousands of units in September.
Due to the quota and limit of national subsidies running into the second half of this year, as well as the high base effect of the fourth quarter of last year, Lotu Technology predicts that China's TV market shipments will experience a greater decline in the fourth quarter of this year, bringing the annual scale to a lower level.
【Copyright and Disclaimer】The above information is collected and organized by PlastMatch. The copyright belongs to the original author. This article is reprinted for the purpose of providing more information, and it does not imply that PlastMatch endorses the views expressed in the article or guarantees its accuracy. If there are any errors in the source attribution or if your legitimate rights have been infringed, please contact us, and we will promptly correct or remove the content. If other media, websites, or individuals use the aforementioned content, they must clearly indicate the original source and origin of the work and assume legal responsibility on their own.
Most Popular
-

AI Computing Power Demand Ignites Electronic Fabrics! China Jushi Hits Limit Up! Domestic Substitution Welcomes Golden Window
-

Focus on going global! kingfa sci. leads, huitong, preter, and kumho nire follow, china’s modified plastics frenziedly expanding worldwide
-

Back-to-back major joker moves! covestro’s 1.32 million ton mdi dual-line expansion and hdi acquisition reshape global polyurethane landscape
-

Evonik Parts Ways With The Polyester Business! A Strategic Retreat By A Germany Chemical Giant And The Global Industry Shift
-

PA66 Cost and Profit: Broad-Based Weakness in the Feedstock Market Continues to Erode Cost Support for PA66 (202606)


