


Appliance Industry in Winter! Air Conditioner Production Plummets Nearly 20%, How Long Can the Plastics Industry Hold On?
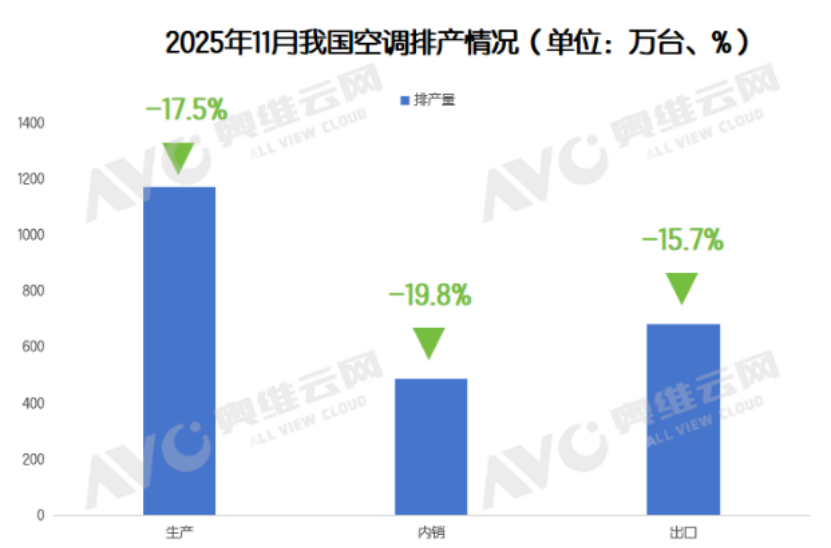
According to data from Aowei Cloud Network, air conditioning production in November has declined significantly for two consecutive months, with domestic sales down 19.8% year-on-year and exports down 15.7%. Data from Industry Online shows that the total production of air conditioning, refrigerators, and washing machines in October decreased by 9.9%, while offline retail sales of air conditioners fell by a staggering 38.1% in September. This data sets the tone for the fourth quarter of the home appliance market, indicating that after experiencing high growth due to policy stimulation, the industry is entering a deep adjustment period.
Market Winter: Production and Retail Both Encounter a Downturn
The air conditioning market is undergoing a deep adjustment. According to data from Aowei Cloud Network, retail sales in September fell by 21.2% year-on-year, with online and offline sales declining by 29.0% and 38.1%, respectively, indicating a significant market slowdown. This downward trend continued into the production plans for November, with domestic and export production plans falling by 19.8% and 15.7%, respectively. The pressure to reduce inventory has become the core factor suppressing domestic sales. Although the overall inventory level in the industry has decreased from the high of 54 million units in June, it remains elevated. Faced with high channel inventory and financial pressures, small and medium-sized dealers are generally adopting a conservative strategy of "ordering based on sales," which further exacerbates the downward pressure on the market.
02 Domestic Sales Dilemma: Multiple Factors Suppress Market Demand
The continued downturn in the real estate market has weakened the demand for new housing accessories, leading to a decline in the activity of the home decoration market, which directly impacts the basic sales volume of offline retail. Additionally, the cooling consumer atmosphere has led to a sharp decrease in store traffic, significantly weakening the customer acquisition capability of traditional channels. Meanwhile, the diminishing effect of national subsidy policies has resulted in a high base effect becoming increasingly evident, and the retail performance in June and July did not meet expectations, exacerbating inventory pressure. More severely, the cost of raw materials continues to rise, with the Shanghai SMEI Copper Index increasing by approximately 10,000 points year-on-year to 85,910.6 as of October 20, while the Aluminum Index remains volatile at a high level between 20,800-21,000. The rigidity in rising costs forces companies to further reduce their production plans for November.
03 Export Markets: Dual Challenges of High Base and Weak Demand
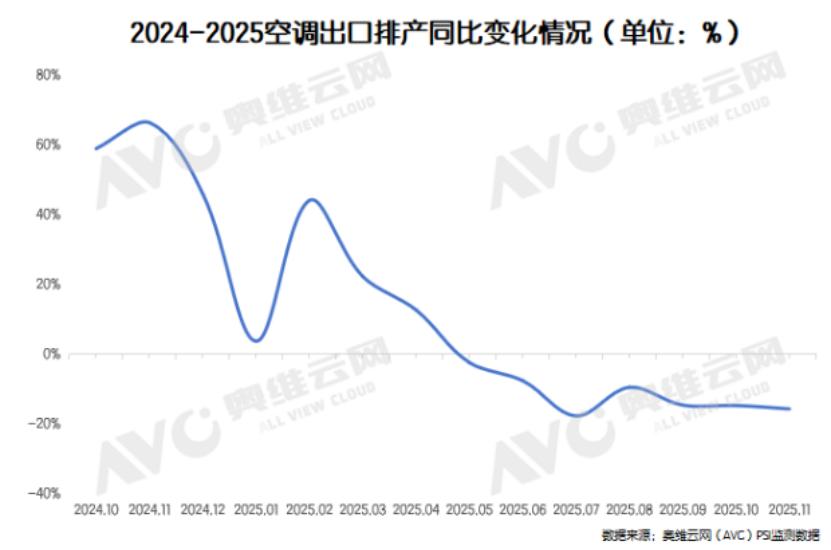
The overseas air conditioning market is also facing severe challenges, with export production scheduling continuing its downward trend in November. The main constraints are the high base effect and weak demand in overseas markets. As the overseas market enters a high base digestion period in 2025, importers' willingness to restock remains low, and channel inventories remain high, directly suppressing the space for new orders to be released. According to data from Industry Online, export production scheduling for household air conditioners in October was 5.96 million units, a decrease of 9.4% compared to the same period last year. Market analysts suggest that the global market's early stocking in the second half of 2024 has led to demand overdraft, and currently, overseas channel inventories are still at high levels. This shift from a restocking cycle to a destocking cycle in the market directly results in a continuous decline in export business.
Quarterly Outlook for Q4: Structural Opportunities Amid Challenges
Despite the online market rebound during the National Day period bringing a glimmer of hope to the industry, the overall home appliance sector still faces significant downward pressure in the fourth quarter. Aowei Cloud Network forecasts that the retail sales of home appliances from September to December will decline by at least 16.4% year-on-year. This prediction is based on the analysis of recent years' data: the growth rate of each quarter in 2025 compared to the same period in 2023 shows a gradual narrowing trend, falling from 4.4% in the first quarter to 3.5% in July-August, and is expected to further slow down to 3.0% from September to December.
The industry is currently undergoing three major challenges: "reduction of national subsidies, high base, and weak external demand." The fading of policy dividends has increased the pressure for a bigger adjustment in categories that benefited greatly last year. Monitoring data from the first half of September shows a double-digit decline in online and offline sales for major categories such as air conditioners, refrigerators, and washing machines. However, this adjustment is also accelerating the industry's transformation from scale expansion to value-driven growth.
Impact of the Plastic Market: Chain Reactions Under Slowing Demand
As an important raw material for home appliance manufacturing, the market for plastics such as ABS and polyolefins will be directly affected by the decline in home appliance production and sales. With the scaling down of home appliance production in the fourth quarter, the demand for plastics will correspondingly weaken. At the same time, the high prices of metals like copper and aluminum have compressed the profit margins of home appliance companies, leading to stricter cost control over raw materials such as plastics and an increased willingness to push prices down. However, the trend of upgrading to high-end and smart product structures may provide some support for the demand for specialty plastics and modified plastics. Overall, the plastic market for home appliances in the fourth quarter is expected to experience a reduction in volume with stable prices and structural differentiation, with limited upward price potential.
Author: Zhaohongyan, Expert in Market Research at Specialized Plastics Vision

【Copyright and Disclaimer】This article is the property of PlastMatch. For business cooperation, media interviews, article reprints, or suggestions, please call the PlastMatch customer service hotline at +86-18030158354 or via email at service@zhuansushijie.com. The information and data provided by PlastMatch are for reference only and do not constitute direct advice for client decision-making. Any decisions made by clients based on such information and data, and all resulting direct or indirect losses and legal consequences, shall be borne by the clients themselves and are unrelated to PlastMatch. Unauthorized reprinting is strictly prohibited.
Most Popular
-

AI Computing Power Demand Ignites Electronic Fabrics! China Jushi Hits Limit Up! Domestic Substitution Welcomes Golden Window
-

Focus on going global! kingfa sci. leads, huitong, preter, and kumho nire follow, china’s modified plastics frenziedly expanding worldwide
-

Back-to-back major joker moves! covestro’s 1.32 million ton mdi dual-line expansion and hdi acquisition reshape global polyurethane landscape
-

Evonik Parts Ways With The Polyester Business! A Strategic Retreat By A Germany Chemical Giant And The Global Industry Shift
-

PA66 Cost and Profit: Broad-Based Weakness in the Feedstock Market Continues to Erode Cost Support for PA66 (202606)


