


Another Oil Giant Lays Off Over 3,000 Employees

According to Reuters, five sources from ConocoPhillips revealed that the company will lay off 20% to 25% of its workforce. Based on its current global workforce, this means 2,600 to 3,250 employees are at risk of losing their jobs. Following the announcement, ConocoPhillips' stock price fell by 3.9% to $95.11.
Dennis Nuss, a spokesperson for ConocoPhillips, told Reuters, "The majority of the layoffs will be completed by the end of the year." According to two sources, the new organizational structure and management plan will be announced in mid-September, and the entire restructuring plan is expected to be fully completed by 2026.
01. Streamline the organization to reduce costs and lay off employees.

ConocoPhillips' recent layoffs are not a temporary decision but an inevitable measure under the goal of integrating resources and improving operational efficiency. As early as April this year, it was reported that the company had hired the Boston Consulting Group (BCG) to support an internal restructuring project called "Competitive Advantage." The project's goal is clear: to enhance efficiency and control costs by centralizing services, eliminating redundant positions, and streamlining organizational layers.
This restructuring is also deeply tied to ConocoPhillips' business integration. After completing the $22.5 billion acquisition of Marathon Oil last year, ConocoPhillips has been committed to cost-cutting. ConocoPhillips Chairman and CEO Ryan Lance stated, "Marathon Oil can bring high-quality, low-cost supply inventory."
Last month, ConocoPhillips revealed in its second-quarter financial report that after completing the asset integration of Marathon Oil Corporation, it expects to achieve a one-time gain of over $1 billion. Additionally, the company announced plans to gradually reduce costs by $1 billion and improve profit margins by the end of 2026. The recent layoffs may be a further effort by the company to deeply integrate resources and enhance operational efficiency.
Even so, it did not alleviate the performance pressure, as ConocoPhillips' net income for the second quarter was only $2 billion, the lowest since the impact of the COVID-19 pandemic in 2021. The dual pressures of performance and costs have made layoffs an "inevitable choice."
02. Layoff Wave Under Multiple Pressures
Notably, the layoffs by ConocoPhillips are not an isolated case. Since 2024, a wave of "layoffs" has been sweeping through the global oil and gas industry, with several industry giants following suit in an attempt to optimize personnel to cope with the ever-changing oil and gas market.
Also an American oil giant, Chevron, earlier this year...Announced a layoff planBy 2026, 15%-20% of the global workforce will be cut, which, based on the current scale, could result in up to 8,000 job losses. Chevron stated that this round of layoffs is a "broad organizational restructuring driven by technological upgrades," with the ultimate goal of saving $2-3 billion in costs while improving operational efficiency.
European oil and gas giant BP is also making significant moves. According to disclosures, BP plans to cut approximately 6,200 corporate positions (accounting for 15% of its office workforce) by the end of the year, along with 4,400 contractor positions. BP has made it clear that these actions are aimed at achieving a structural cost reduction of $2 billion in response to changes in the industry environment.
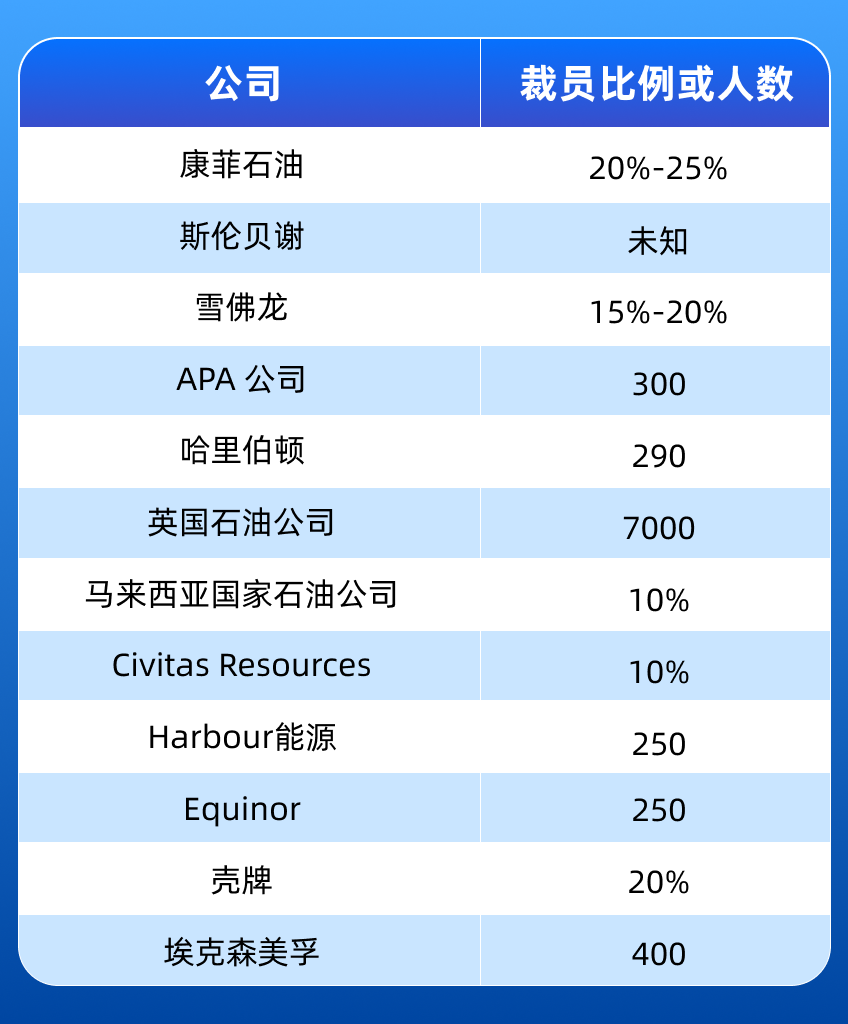
▲ Announcement of layoffs by oil and gas companies in 2024-2025. Source: Reuters
From a regional market perspective, the oil and gas industry is also experiencing significant "streamlining pressure." According to information released by Reuters, oil and gas companies that have announced layoffs in 2024-2025 plan to cut more than 20,000 jobs in total. Data from the Houston Chronicle shows that, in Texas alone, nearly 3,000 jobs in the upstream oil and gas sector (including exploration and development) have been cut since this summer. The decrease in local drilling activity and oil price fluctuations both indicate that the industry is undergoing a broader structural transformation.
The underlying reasons for the global oil and gas giants collectively "cutting jobs and reducing expenses" are the result of multiple pressures. On one hand, the growth in oil demand is showing signs of fatigue. Although the global economy is gradually recovering, the growth in oil and gas demand has not met expectations. In some regions, the adjustment of the energy structure and slowing economic growth have reduced reliance on traditional oil and gas. On the other hand, development and operational costs continue to rise. In 2024, global oil and gas exploration and development investment is expected to decrease by 2.5% year-on-year, while development costs have doubled over the past five years. Operational costs are also continuously increasing; for instance, ConocoPhillips faces a $2 per barrel cost disadvantage, affecting competitiveness, and factors such as global supply chain fluctuations and rising raw material prices further drive up operational costs. Additionally, the headwinds brought by the energy transition also exert pressure. Currently, the global energy structure is rapidly transitioning towards clean energy, and oil and gas companies face the dual tasks of "shrinking traditional business" and "expanding into new energy," requiring capital to be reallocated to the more promising new energy sector.
From an industry perspective, this wave of layoffs may signal an acceleration of "quality improvement and efficiency enhancement" in the oil and gas sector. On one hand, companies are streamlining organizations and introducing technological upgrades (such as Chevron's technology-driven adjustments) to improve the efficiency of traditional operations; on the other hand, the funds saved from cost reductions may be increasingly invested in the new energy sector, helping companies seize opportunities in their transition.
Overall, this wave of layoffs in the global oil and gas industry is a self-adjustment under the triple pressures of demand, cost, and transition. For traditional oil and gas giants, layoffs are merely a means to address short-term challenges. The key to long-term development lies in balancing the stability of traditional business with the layout of new energy, while controlling costs.
【Copyright and Disclaimer】The above information is collected and organized by PlastMatch. The copyright belongs to the original author. This article is reprinted for the purpose of providing more information, and it does not imply that PlastMatch endorses the views expressed in the article or guarantees its accuracy. If there are any errors in the source attribution or if your legitimate rights have been infringed, please contact us, and we will promptly correct or remove the content. If other media, websites, or individuals use the aforementioned content, they must clearly indicate the original source and origin of the work and assume legal responsibility on their own.
Most Popular
-

AI Computing Power Demand Ignites Electronic Fabrics! China Jushi Hits Limit Up! Domestic Substitution Welcomes Golden Window
-

Focus on going global! kingfa sci. leads, huitong, preter, and kumho nire follow, china’s modified plastics frenziedly expanding worldwide
-

Back-to-back major joker moves! covestro’s 1.32 million ton mdi dual-line expansion and hdi acquisition reshape global polyurethane landscape
-

Evonik Parts Ways With The Polyester Business! A Strategic Retreat By A Germany Chemical Giant And The Global Industry Shift
-

PA66 Cost and Profit: Broad-Based Weakness in the Feedstock Market Continues to Erode Cost Support for PA66 (202606)


