



North American Robot Orders Revenue Grows 21%
According to the latest data from the Association for Advancing Automation (A3), North American manufacturers ordered 8,940 robots in the second quarter of 2026, valued at $622 million, marking significant growth in an increasingly diversified market.

Second-quarter data indicate that despite economic uncertainties, manufacturers continue to invest in automation, with non-automotive industry customers leading the adoption trend. Getty Images
North American manufacturers, including plastic processing enterprises, continue to heavily invest in automation, ordering nearly 9,000 robots worth $622 million in the second quarter of 2026—a 21% increase in revenue—marking a fundamental shift in the robotics market from being dominated by the automotive industry to a more diversified industrial robotics market driven by semiconductors, life sciences, and food production.
Second-quarter results show that, compared with the same period in 2025, the number of units ordered increased by 4.3% and revenue rose by 21.3%. For the first half of the year, total volume reached 17,995 units, valued at $1.166 billion, representing a 2.0% increase in units and a 6.6% increase in order value compared with the first half of 2025.
The data reveals a structural shift in robot demand, with growth spreading to multiple manufacturing sectors beyond traditional automotive applications. Orders from automotive original equipment manufacturers (OEMs) fell by 25% in the first half of 2025, but substantial growth across several general industrial sectors offset the weakness in the automotive industry.
Semiconductors and life sciences drive industry growth.
The semiconductor and electronics/photonics sector leads the expansion with a 35% increase in orders, followed by the life sciences/pharmaceutical/biomedical sector with a 32% growth. Orders for automotive parts grew by 24%, while the food and consumer goods sector saw a 17% increase. The plastics and rubber industry grew by 6%, matching the 6% increase seen in all other sectors. The metal industry ranks last among the growth sectors with a 3% increase.
“The first half of 2026 showed the robot market’s ongoing structural evolution,” said A3 Executive Vice President Alex Hikani. “The automotive industry remains an important driver of demand, while we are also seeing growth expand into a broader range of industries. Performance varies by sector, but the breadth of growth beyond automotive OEMs is an important trend we will continue to monitor.”
Accelerating industry diversification in the second quarter
In the second quarter alone, robot orders in multiple industries achieved double-digit year-over-year growth. Semiconductors and electronics/photonics grew by 38% year over year, while automotive components grew by 20%. Food and consumer goods, as well as metals, each grew by 18%, and life sciences/pharmaceuticals/biomedicine grew by 9%.
Non-automotive customers accounted for 56% of robot units ordered in the quarter, continuing the trend of widespread adoption across industries and signaling a maturing market that is no longer reliant on a single industry.
The market share of collaborative robots continues to grow.
In the first half of 2026, collaborative robots continued to account for an important share of automation investment. Enterprises ordered 2,774 collaborative robots, worth US$114 million, accounting for 15.4% of all robot orders and 9.8% of total order revenue.
In Q2 alone, companies ordered 1,137 collaborative robots, worth $44 million, accounting for 12.7% of total units and 7.1% of quarterly revenue. Collaborative robots were particularly strong in applications in life sciences/pharmaceuticals/biopharma and semiconductor & electronics/photonics, accounting for 43.7% and 36.5% of robot orders in the first half of the year, respectively.
The number of installations is rising.
According to the latest data from the International Federation of Robotics (IFR), U.S. industrial robot installations in 2025 increased by 11% year on year to 38,000 units. This rebound was driven by strong growth in the food industry and other non-manufacturing sectors. However, the automotive industry remained the largest application area, with installations reaching 13,500 units, only 1% lower than last year.
“The United States is back on a growth trajectory,” said Takayuki Ito, President of the International Federation of Robotics. “The automotive industry posted its third-best result in seven years, while the data highlight the growing demand for flexible automation in the food industry: adoption in this sector surged by 30% and is now on par with the metal and machinery and electrical/electronics industries, with installations of around 3,000 units each in 2025.”
Measured by robot density, the U.S. manufacturing industry has 307 industrial robots in operation per 10,000 employees, ranking eighth globally in automation level (up two places from last year), behind only the most highly automated countries such as South Korea (1,220), Germany (449), and Japan (446), but ahead of China (166).
Economic indicators support continued automation investment.
Despite overall economic uncertainties, manufacturers continued to invest in automation in the first half of 2026. The manufacturing PMI in June remained in the expansion zone for the sixth consecutive month, with new orders and production continuing to grow. Federal Reserve data also showed that manufacturing output in June was 1.1% higher than the same period last year.
Although the timing of major automotive OEM projects and broader economic conditions will continue to impact quarterly performance, data from the first half of the year indicates that manufacturers still regard automation as a long-term investment to enhance competitiveness.
For more detailed market segmentation data and charts for Q2 2026, media outlets may obtain them upon request, and member companies can access them in A3 Vault. A3 members can subscribe to MI+—the association’s premium market intelligence platform—which provides forecasts, dashboards, and in-depth reports to support better decision-making.
【Copyright and Disclaimer】This article is the property of PlastMatch. For business cooperation, media interviews, article reprints, or suggestions, please call the PlastMatch customer service hotline at +86-18030158354 or via email at service@zhuansushijie.com. The information and data provided by PlastMatch are for reference only and do not constitute direct advice for client decision-making. Any decisions made by clients based on such information and data, and all resulting direct or indirect losses and legal consequences, shall be borne by the clients themselves and are unrelated to PlastMatch. Unauthorized reprinting is strictly prohibited.
Most Popular
-
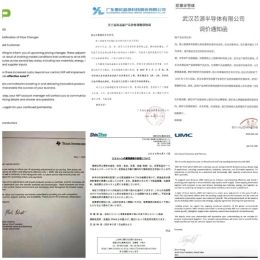
2026 Electronic Components Price Increase Notice
-

Rhein River Water Level Hits Record Low! Covestro And BASF Announce Force Majeure For Some Products
-

A Look at the Material Suppliers Behind SpaceX
-

Grupo Plastilene and ExxonMobil Set a New Benchmark for Packaging
-

One Fabric Hard to Find! AI Computing Power Sparks Market Trends, How Long Can the Plastics Material Dividend Last?